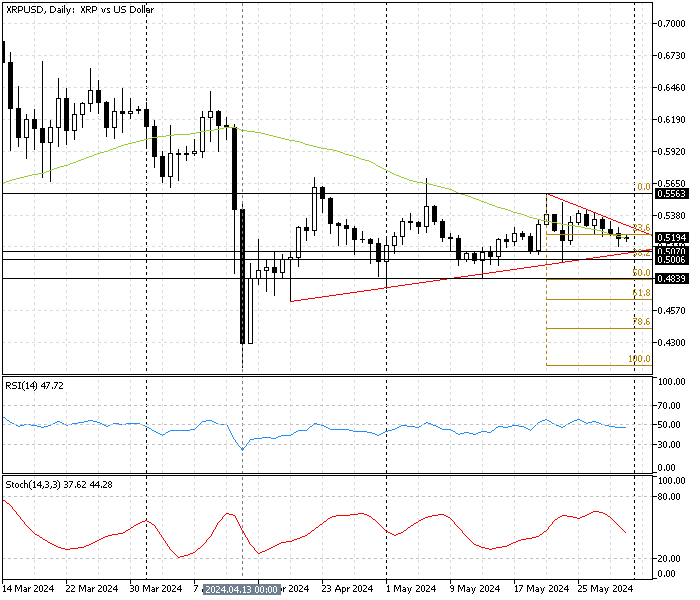
FxNews—Ripple trades sideways against the U.S. Dollar at about $0.51. The XRP/USD pair currently trades inside the symmetrical triangle approaching the apex, as shown in the daily chart below.

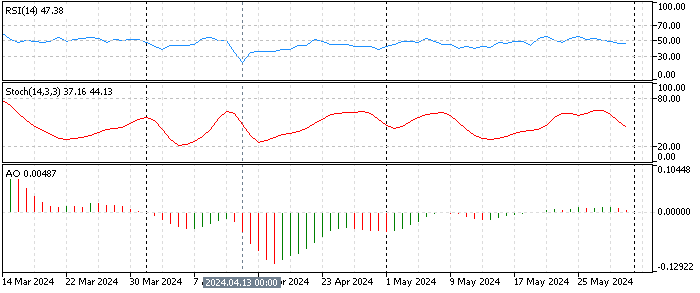
The technical indicators in the daily chart suggest a sideway market without bullish or bearish momentum.
- The awesome oscillator value is 0.004. The small bars cling to the signal line, suggesting the market lacks velocity.
- The RSI (14) value is 48, moving horizontally alongside the middle line, signifying a lack of momentum in the trend.
- The Stochastic oscillator value is 38 and declining. This suggests a low-momentum market with a mild bearish outlook.

XRP/USD Technical Analysis 4-Hour Chart

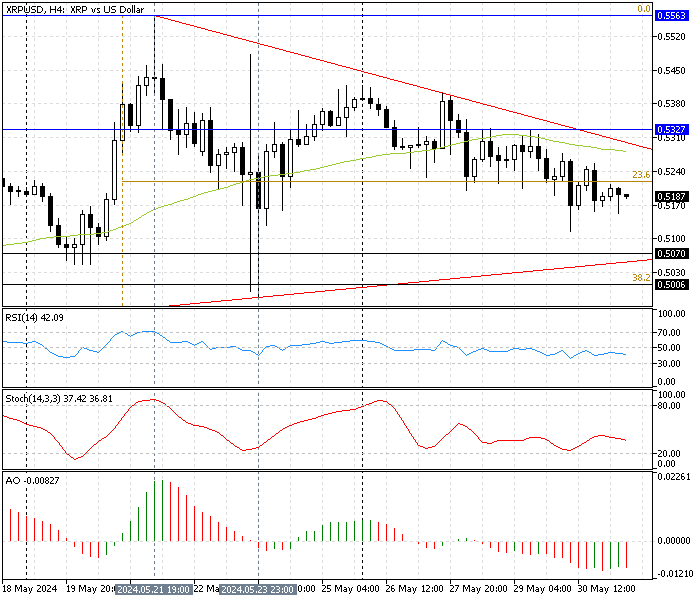
We zoom into the 4-hour chart for a detailed analysis and find critical levels and trading opportunities. The chart above shows the Ripple price below the descending trendline and SMA 50, suggesting a bearish trend. The technical indicators in the 4-hour chart suggest a low momentum market but with a mild bearish outlook.
- The awesome oscillator bars are below the signal line, showing a value of -0.008 in the description.
- The relative strength index indicator value is 43, below zero, with a low momentum but with a mild downtrend outlook.
Ripple Price Forecast – XRP Mild Bearish Outlook

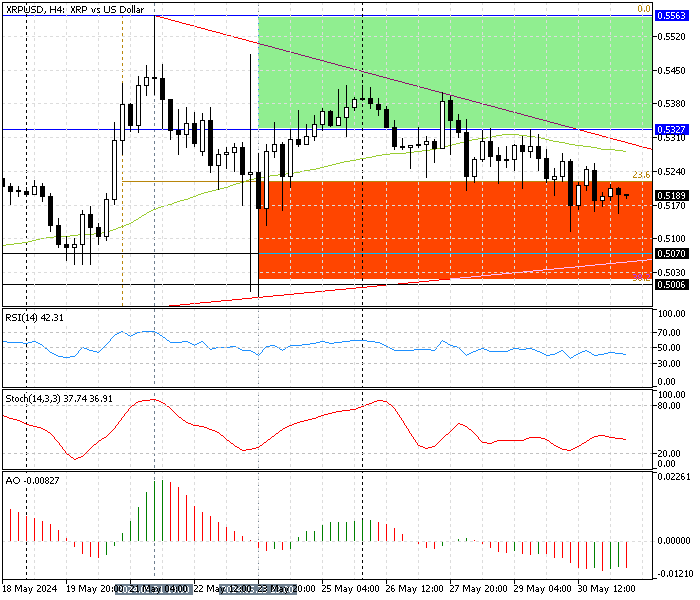
The primary trend should be considered bearish from a technical perspective because the Ripple price is below the descending trendline and SMA 50. We expect the mild bearish momentum to continue and target the ascending trendline of $0.507, followed by the 38.2% Fibonacci level at $0.50. If the selling pressure exceeds the 38.2% Fibonacci, the next significant support will be the %50 Fibonacci at $0.48.
The bearish outlook should be invalidated if the Ripple price crosses and stabilizes above the descending trendline at $0.532.
XRP/USD Bullish Scenario
If the Ripple price crosses above the immediate resistance, which is the descending trendline at $0.532, the mild bullish wave started on April 13 can once again target the May 21 high at $0.556/
Ripple Support and Resistance Levels
Traders and investors should closely monitor the key levels below to make informed decisions and adjust their strategies accordingly as market conditions shift.
- Support: $0.507 / $0.50 / $0.483
- Resistance: $0.532 / $0.553
Disclaimer: This technical analysis is for informational purposes only. Past performance is not necessarily indicative of future results. Foreign exchange trading carries significant risks and may not be suitable for all investors. Always conduct your research before making any investment decisions.