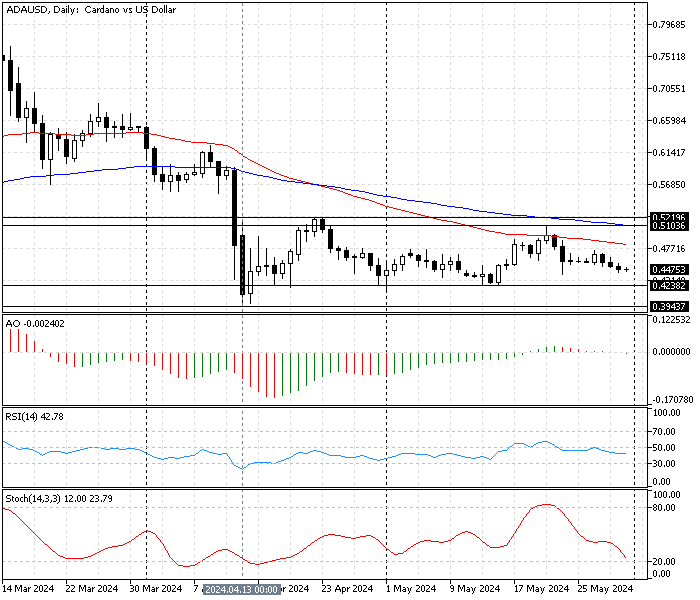
FxNews—Cardano traded at about $0.448 against the U.S. Dollar in today’s trading session. As shown in the ADA/USD daily chart below, the primary trend is bearish, but the price has been moving sideways since the April 13 dip to the $0.394 mark.
This development in the Cardano price resulted in the market creating new lower highs and higher lows. Consequently, the price has been ranging in a narrow horizontal channel between $0.521 resistance and $0.423 support since April 13.

The technical indicators in the ADA/USD daily chart are interpreted as below:
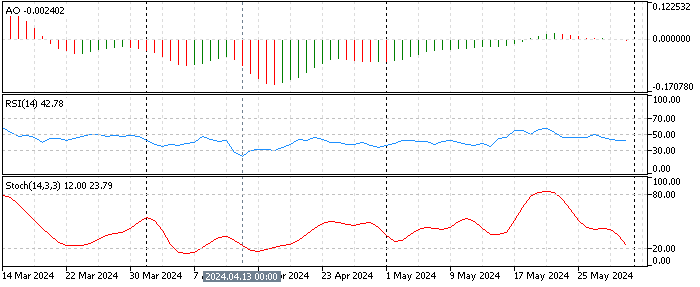
- The awesome oscillator has been attached to the zero line for the 8th consecutive day, which indicates that the Cardano trading market has no significant trend.
- The RSI value is below the middle line, depicting 42 in the description, which suggests a low-momentum market with a mild downtrend.
- The stochastic line approaches the oversold area, currently at 23. This decline in the indicator’s value suggests the market might become oversold soon, and there might be a trend reversal or a pullback.

These developments in the technical indicators in the ADA/USD daily chart suggest the market lacks momentum. Still, the trend is slightly bearish, and the Cardano price might fall to the next support level.
Cardano Analysis 4-Hour Chart

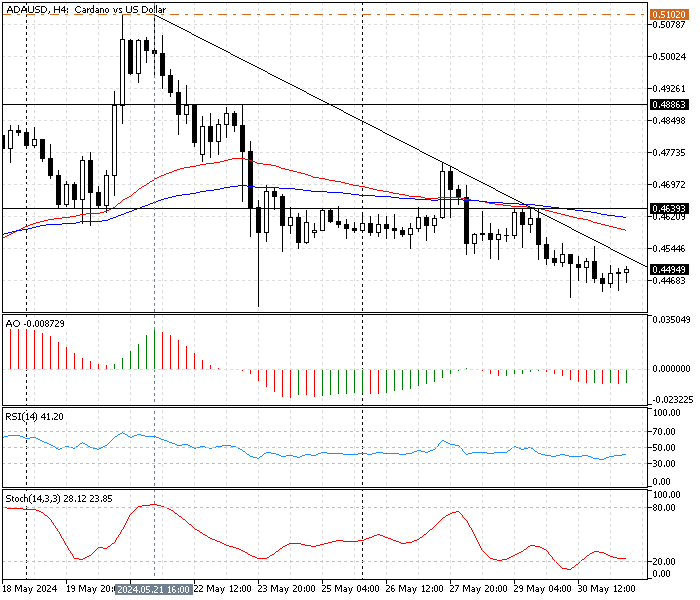
The 4-hour Chart provides a detailed analysis. As depicted in the image above, the ADA/USD pair hovers below the descending trendline, SMA 50 and 100. This means the trend is bearish, and a further decrease in the price could be imminent.
- The awesome oscillator indicator record shows -0.0088. The bars are below the zero line, and the colors constantly change from green to red and vice versa. This behavior in the indicator shows an uncertain market with no significant trend.
- The RSI (14) value is described as 38. The line is below 50, suggesting mild bearish momentum.
- The Stochastic oscillator value is 25. The indicator returned from the oversold area, signifying a mild bullish momentum.

These developments in the technical indicator suggest the ADA/USD is in an uncertain and trendless market where traders and investors should approach it cautiously.
Cardano Analysis – 31-May-2024

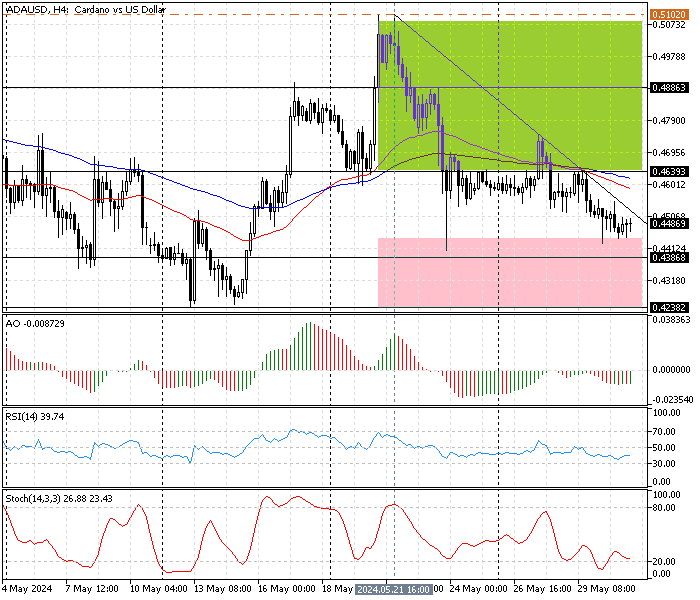
The technical indicators show a sideways market with a mild bearish trend. The price below the descending trendline suggests the bearish momentum could escalate soon. From a technical perspective, if the bears maintain Cardano’s price below the immediate resistance at $0.463, the bearish wave that began on May 21 will likely target the $0.423 resistance, followed by April’s all-time low at $0.394.
Note: The bearish outlook should be invalidated if the Cardano price exceeds the immediate support ($0.463).
Cardano Bearish Scenario
If the bulls exceed the ADA/USD price above the immediate resistance at $0.4639, the next bullish target should be the May 21 high at 0.510. If this scenario unfolds, the immediate support for the bullish trend will be the $0.438 mark.
ADA/USD Key Support and Resistance Level
Traders and investors should closely monitor the key levels below to make informed decisions and adjust their strategies accordingly as market conditions shift.
- Support: $0.438 / $0.423
- Resistance: $0.463 / $0.488 / $0.510
Disclaimer: This technical analysis is for informational purposes only. Past performance is not necessarily indicative of future results. Foreign exchange trading carries significant risks and may not be suitable for all investors. Always conduct your research before making any investment decisions.