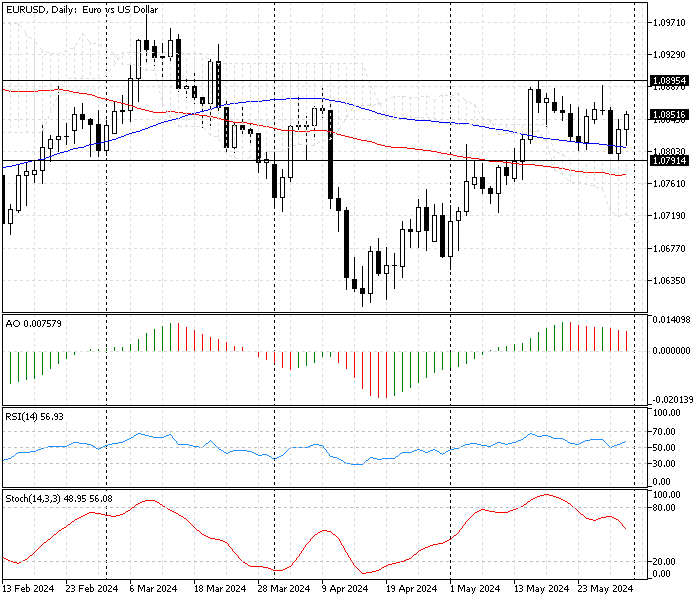
FxNews—The European currency (euro) traded at about $1.085 against the U.S. Dollar in today’s trading session. The EUR/USD daily chart below represents the daily chart where the bullish momentum returned after the price dipped to the Ichimoku Cloud resistance at $1.079.

EURUSD Technical Analysis – 31-May-2024
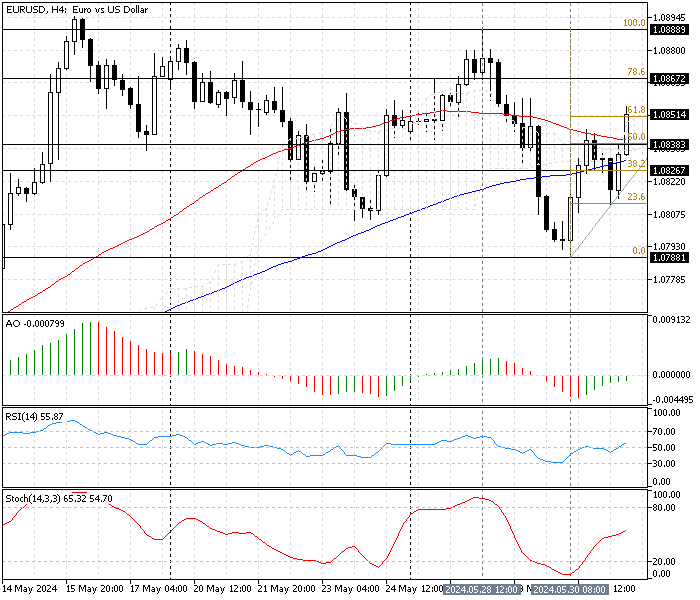
We zoom into the EUR/USD 4-hour chart for a detailed analysis and find key levels and trading opportunities. This chart shows that the bulls pushed the price above the 50% Fibonacci at $1.083. This development in the EUR/USD price drove the market above the simple moving average of 100, which indicates an uptrend prevails.

The technical indicators in the EUR/USD 4-hour chart suggest the market is bullish, and the price will likely aim for higher resistance levels.
- The awesome oscillator bars are approaching the signal line from below with green bars. This means the bullish momentum is gaining strength.
- The relative strength index (RSI) value is 56, above the median line. This growth in the RSI (14) line implies the uptrend is gaining impetus, and the price can elevate since the RSI has a lot of room left to become overbought.
- The Stochastic oscillator value is 67 and boosting. This suggests the current uptick bias is escalating and can climb higher.
EURUSD Forecast – 31-May-2024

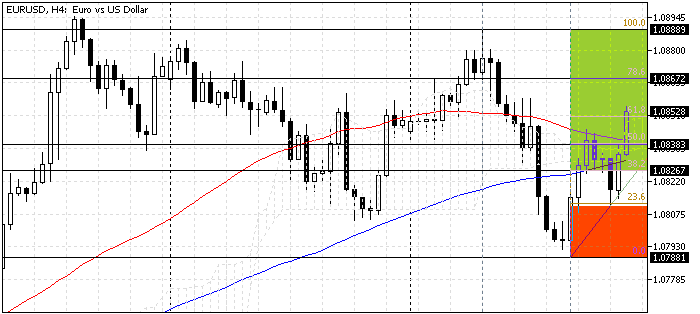
From a technical perspective, the primary trend is bullish because the price is above the Ichimoku cloud on the daily and 4-hour charts. Interestingly, the bulls are trying to stabilize the price above SMA 50, another bullish signal. The key support level for the uptrend is the 38.2% Fibonacci level at $1.082.
If the EUR/USD stays above the key support at $1.082, the next bullish target should be the 78.6% Fibonacci at $1.086, followed by the May 28 high at $1.088.
Note: The uptrend outlook should be invalidated if the EUR/USD price dips below the key resistance level at $1.082. This supply zone is backed by SMA 100, suggesting it is a substantial barrier for the sellers.
EUR/USD Bearish Scenario
If the bears cross below the SMA 100, which neighbors with 38.2% Fibonacci at 1.082, the downtrend started on May 28 could retest the May 30 low at $1.078. If this scenario occurs, the %50 Fibonacci level at $1.083 will be the key resistance level for the downtrend.
Key Support and Resistance Levels
Traders and investors should closely monitor the key levels below to make informed decisions and adjust their strategies accordingly as market conditions shift.
- Support: $1.083 / $1.082
- Resistance: $1.086 / $1.088