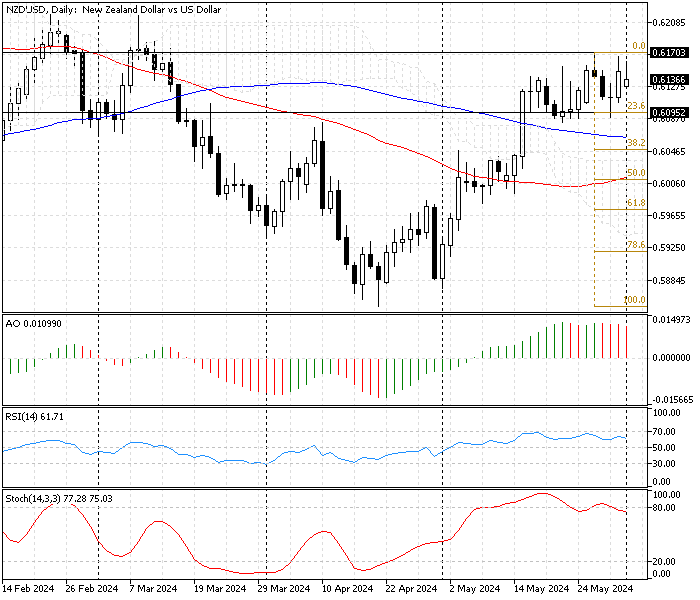
FxNews—The New Zealand dollar trades in an uptrend against the U.S. Dollar. The NZD/USD daily chart below shows the currency pair is trading bullish at about 0.613, above SMA 50, SMA 100, and the Ichimoku Cloud indicators. This development in the technical indicators promises the uptrend should continue.

NZD/USD Technical Analysis 4-Hour Chart
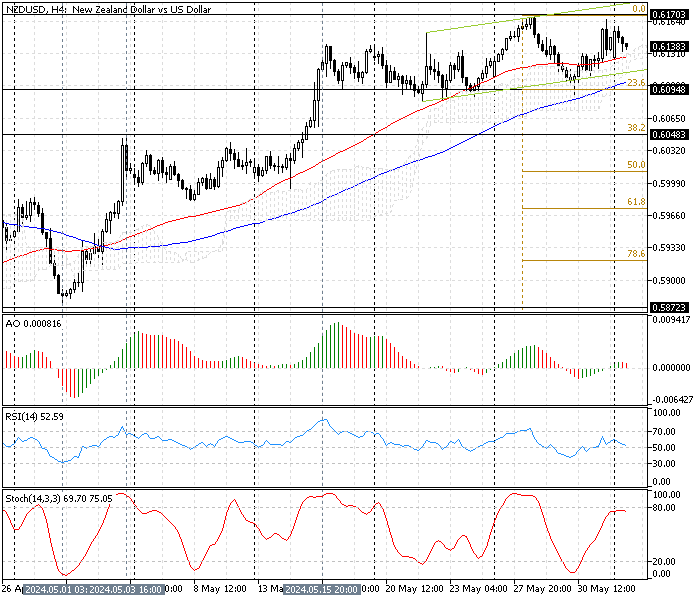
The NZD/USD 4-hour chart below shows the market stabilized above the 23.6% Fibonacci level at $0.6094. This Fibo level provides key support to the bullish momentum. Despite the robust uptrend that started on May 1 at $0.587, the momentum eased after the price peaked at $0.617.
As a result, the NZD/USD trend has been moving sideways since May 15. This trend development should be considered a consolidation phase where the dollar tries to erase some of its losses against the New Zealand dollar.

The Technical Indicators Give Mixed Signals

The technical indicator gives mixed and complex signals, as explained below.
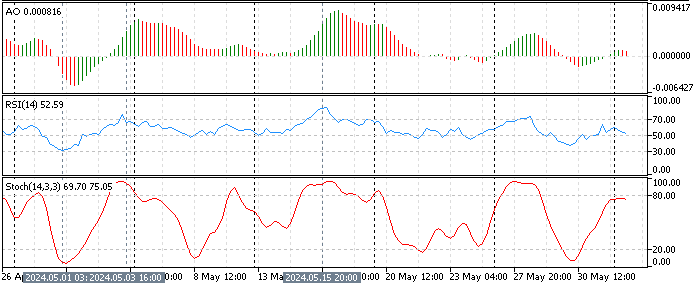
- The Awesome oscillator bars are small, red, and above the zero line, depicted as 0.0008 in the description. This means the trend has lost its bullish momentum, at least for now, and has bearish tendencies in the short term.
- The relative strength index value is 51, close to the median line, meaning the market suffers from a lack of momentum and is neither bullish nor bearish currently.
- The Stochastic oscillator value, depicted as 68, is nearing overbought territory. This growth in the stochastic oscillator is interpreted as the currency pair being overpriced, and a consolidation phase could be on the horizon.
These developments in the technical indicators in the NZD/USD 4-hour chart suggest the trend is moving sideways with weak bearish tendencies.
NZDUSD Forecast – 3-June-2024

From a technical perspective, the NZD/USD primary uptrend is bullish. However, the $0.617 resistance has halted further growth for now. The technical indicators suggest short-term bearish momentum.
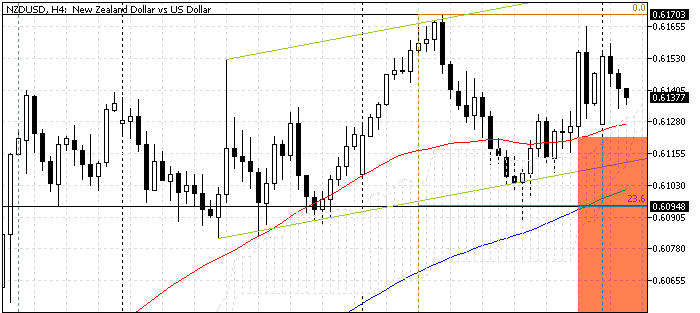
If the NZD/USD price maintains its position below the key resistance level at $0.617, the consolidation phase could again target the 23.6% Fibonacci level at $0.6094. Notably, the $0.6098 is backed by the SMA 100 and the Ichimoku cloud, making it a robust demand zone.
Furthermore, if the selling pressure exceeds $0.6098, the 38.2% Fibonacci retracement level should be set as the next resistance level. This resistance is backed by the May 1 high.
Bullish Scenario
The key barrier that held the primary trend (bullish) to resume is $0.617. If the NZD/USD price crosses above this resistance, the path to $0.621 should be paved. If this scenario comes into play, SMA 50 and SMA 100 will support.
NZDUSD Key Levels – 3-May-2024
Traders and investors should closely monitor the key levels below to make informed decisions and adjust their strategies accordingly as market conditions shift.
- Support: $0.609 / $0.604
- Resistance: $0.617 / $0.621
Disclaimer: This technical analysis is for informational purposes only. Past performance is not necessarily indicative of future results. Foreign exchange trading carries significant risks and may not be suitable for all investors. Always conduct your research before making any investment decisions.