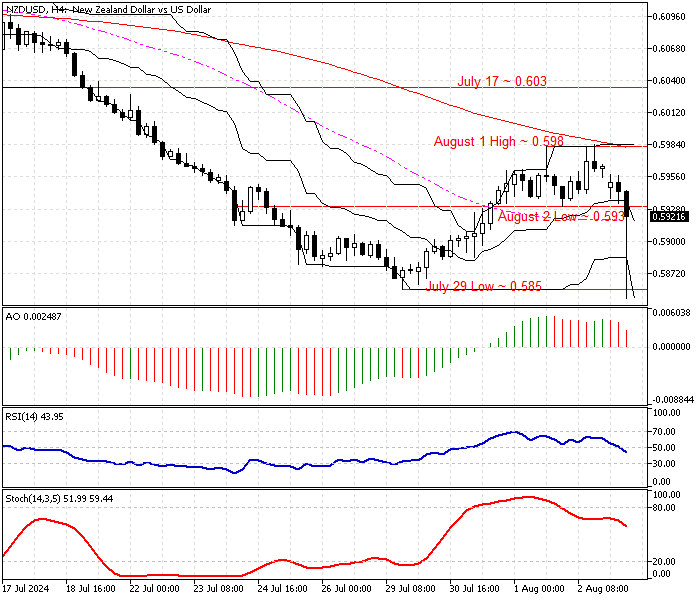
FxNews—The New Zealand Dollar bounced from its July 29 low of approximately $0.585 against the U.S. Dollar. As of writing, the NZD/USD pair is testing the August 2 low at $0.593 as resistance and filling today’s ‘fair value gap.’
The NZD/USD 4-hour chart below demonstrates the price, key support and resistance levels, and the technical indicators utilized in today’s analysis.

NZDUSD Technical Analysis – 5-August-2024
The currency pair’s primary trend is bearish because the price is below the 50 and 100-period simple moving average. Other technical indicators suggest the bearish trend should resume.

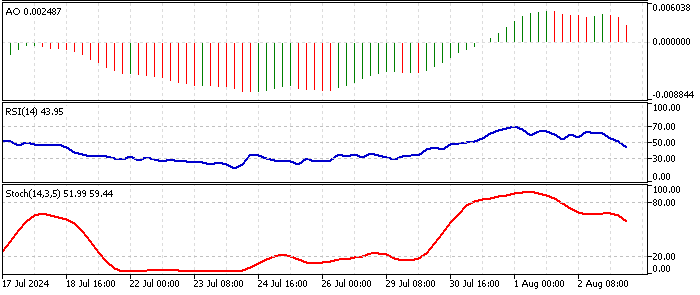
- The awesome oscillator indicator bars are red, above the signal line, depicting 0.002 in the value. This means the bearish trend prevails.
- The relative strength index indicator value dropped below the median line, recording 44 in the description, indicating that the bear market is stronger.
- The stochastic oscillator stepped below the oversold territory, heading toward the middle with the %K line value 52, meaning the primary momentum is in the favor of sellers.
NZDUSD Forecast – 5-August-2024

Despite the primary trend, which is bearish, the bounce we are witnessing from the July 29 low at $0.585 is significant enough to potentially result in a trend reversal or a consolidation phase to upper resistance levels.
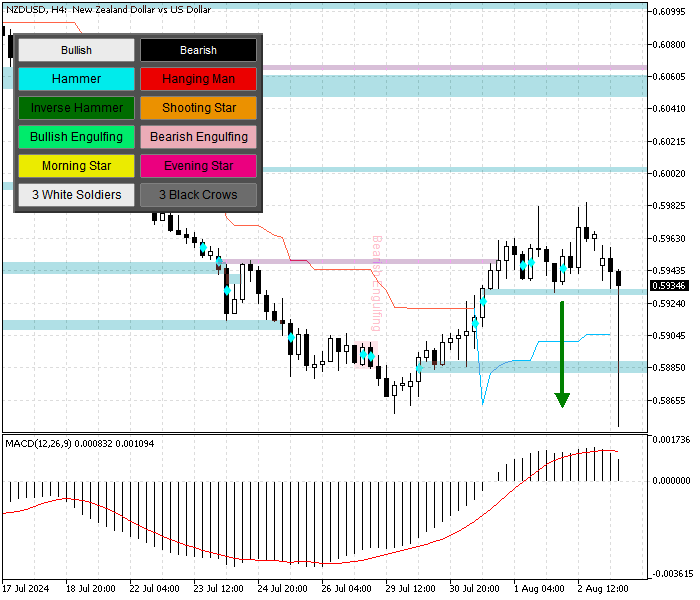
Currently, the bulls (buyers) have the 50-period SMA-backed resistance at $0.593 as their primary barrier. Therefore, we suggest retail traders and investors watch this level closely and look for bearish candlestick patterns.
If the price remains below $0.593, the downtrend will likely resume, initially retesting the July 29 low.
- Also read: Crude Oil Technical Analysis – 2-August-2024
NZDUSD Bullish Scenario – 5-August-2024

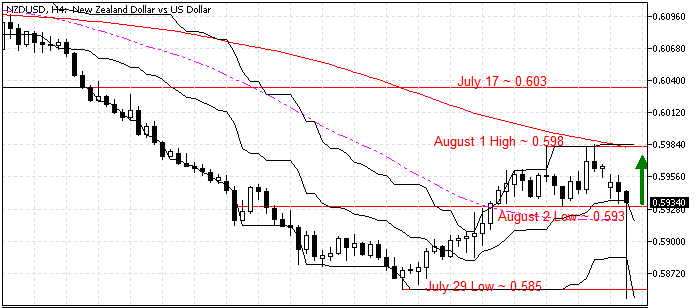
The August 2 low at $0.593 is the immediate resistance. For the current pullback to resume, the bulls must close and stabilize above the 50-period SMA-backed resistance, the $0.593 mark.
If this scenario unfolds, the bullish momentum began from $0.585 will likely rise to test the 100-period backed resistance at $0.603, the July 17 high,
NZDUSD Support and Resistance Levels – 5-August-2024
Traders and investors should closely monitor the key levels below to make informed decisions and adjust their strategies accordingly as market conditions shift.
- Support: $0.585
- Resistance: $0.593 / $0.598 / $0.603
Disclaimer: This technical analysis is for informational purposes only. Past performance is not necessarily indicative of future results. Foreign exchange trading carries significant risks and may not be suitable for all investors. Always conduct your research before making any investment decisions.