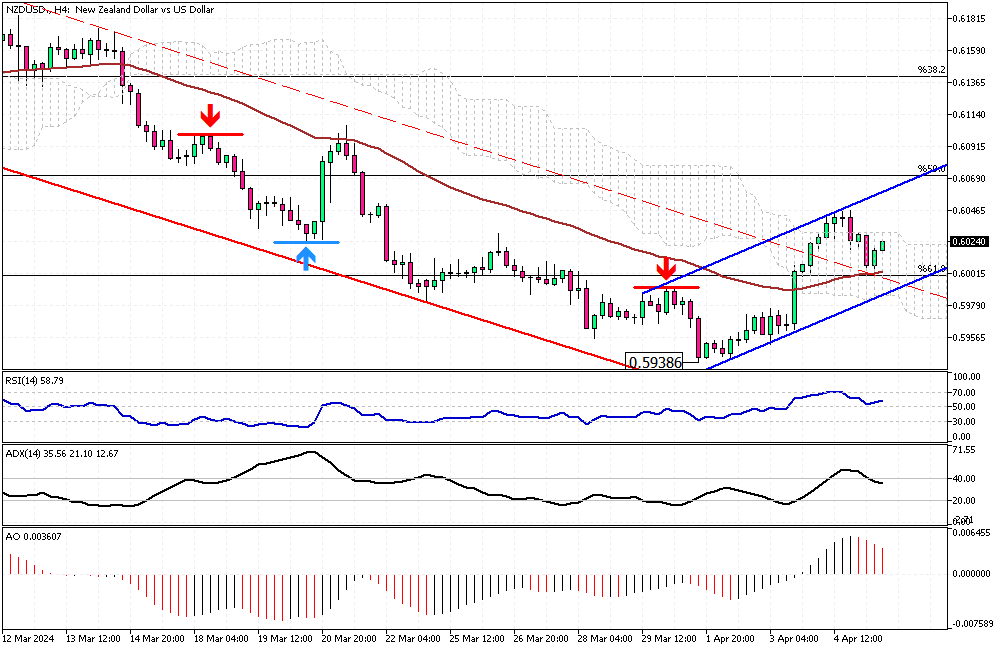
FxNews – The NZDUSD bulls broke through the descending trend line, as shown in the pair’s 4-hour chart below. As of writing, the currency pair is experiencing a pullback and is trading at about 0.602, nearing the EMA 50 and testing the broken trend line.
The technical indicators give mixed signals. The RSI hovers above the 50 level, indicating a bullish trend. On the other hand, the AO bars are red, and the pair has not yet stabilized itself above the Ichimoku cloud. This could be interpreted as a weak uptick in momentum that began from the 0.5938 mark. Therefore, going long on this pair should be done with caution.

NZDUSD Technical Analysis: EMA 50 Plays the Pivot
From a technical perspective, the NZDUSD price is within the bullish channel and above the EMA 50 and the 61.8% Fibonacci support level. If the bulls maintain their position above these levels, the uptick momentum could continue, and the next target could be the 50% Fibonacci resistance level, located at 0.6070.
On the flip side, what would cancel the current bull market is if the price dips below the 0.6 mark, in conjunction with the 61.2% Fibonacci level.