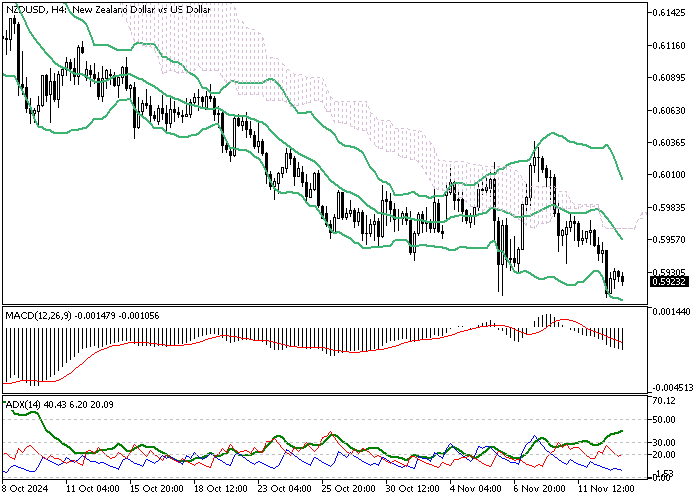
On Wednesday, the New Zealand dollar traded around $0.592, nearing its lowest point since early August. This decline is partly due to a stronger U.S. dollar. Investors expect U.S. Treasury yields to rise because President-elect Trump’s pro-tariff policies might lead to higher inflation.
As a result, they are waiting for U.S. consumer inflation data to come out later today, hoping it will clarify the Federal Reserve’s future monetary policy.

China Disappoints Markets Anticipating N.Z. Rate Cuts
Adding to the downward pressure, China’s recent stimulus efforts didn’t meet investor expectations. This shortfall dampens demand prospects from China, New Zealand’s largest trading partner.
Meanwhile, at home, markets anticipate that the Reserve Bank of New Zealand will cut interest rates by another 50 basis points later this month. A larger cut of 75 basis points is even possible.
NZDUSD Technical Analysis – 13-November-2024

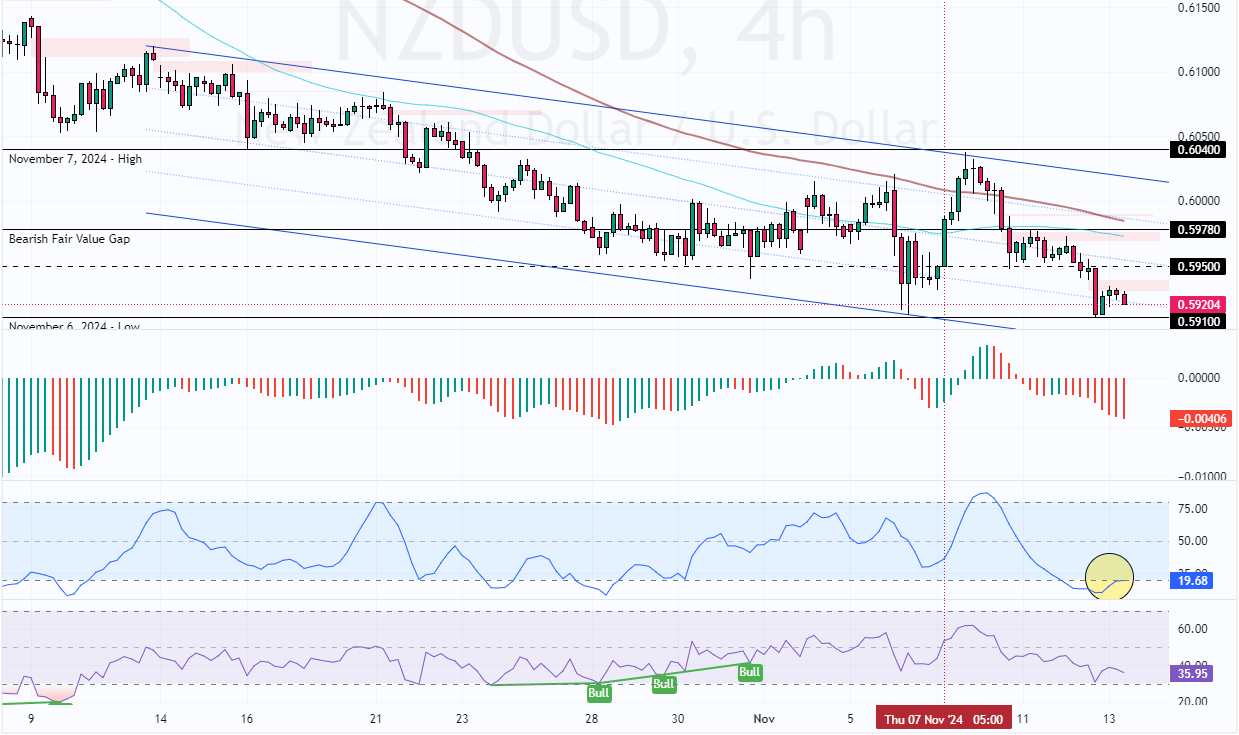
The currency pair‘s primary trend is bearish because the price is below the 100-period simple moving average. However, the Stochastic Oscillator records show that the NZD/USD is oversold, meaning the price can potentially bounce from $0.591.
From a technical perspective, it is not advisable to join a downtrend when it is saturated from selling pressure. Hence, we suggest waiting for NZD/USD to consolidate near the 100-period SMA at approximately $0.597. This level is further backed by the bearish Fair Value Gap, making a reliable resistance. Therefore, traders and investors should monitor the 0.597 resistance closely for bearish signals, such as candlestick patterns.
- Good read: GBPUSD Drops as U.K. Unemployment Hits 4.3%
NZDUSD Eyes Further Drop to August 5 Low

That said, the outlook of the NZD/USD trend remains bearish as long as it trades below $0.604, the November 7 high. In this scenario, the next bearish target after a minor consolidation could be the August 5 low at 0.585.
- Support: 0.591 / 0.585
- Resistance: 0.595 / 0.597 / 0.604