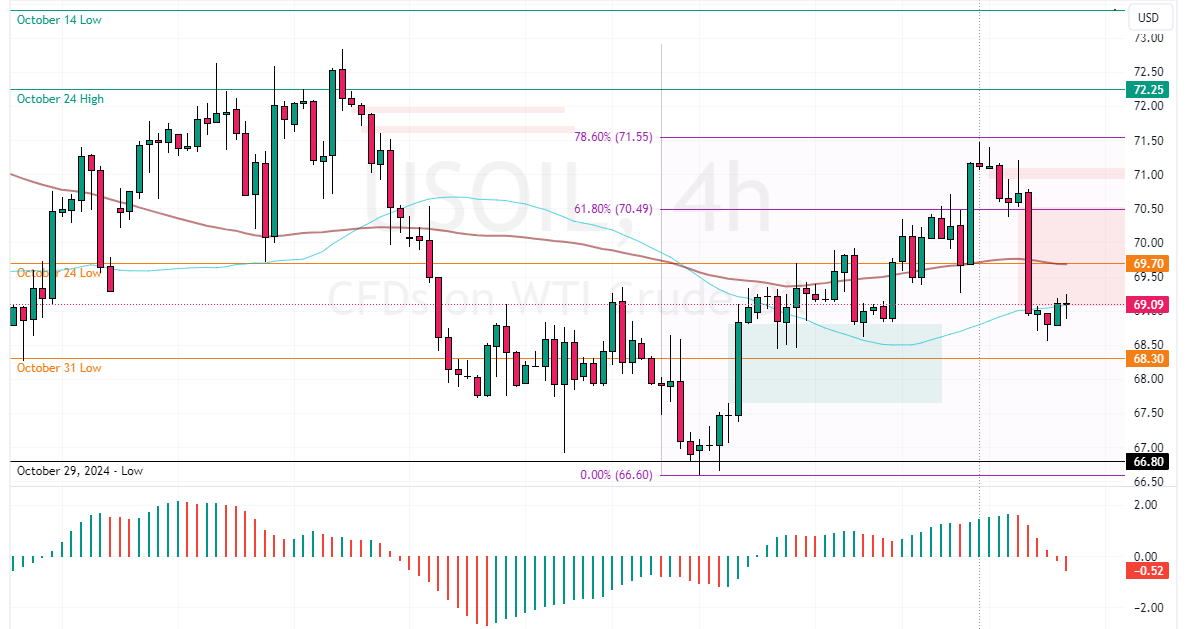
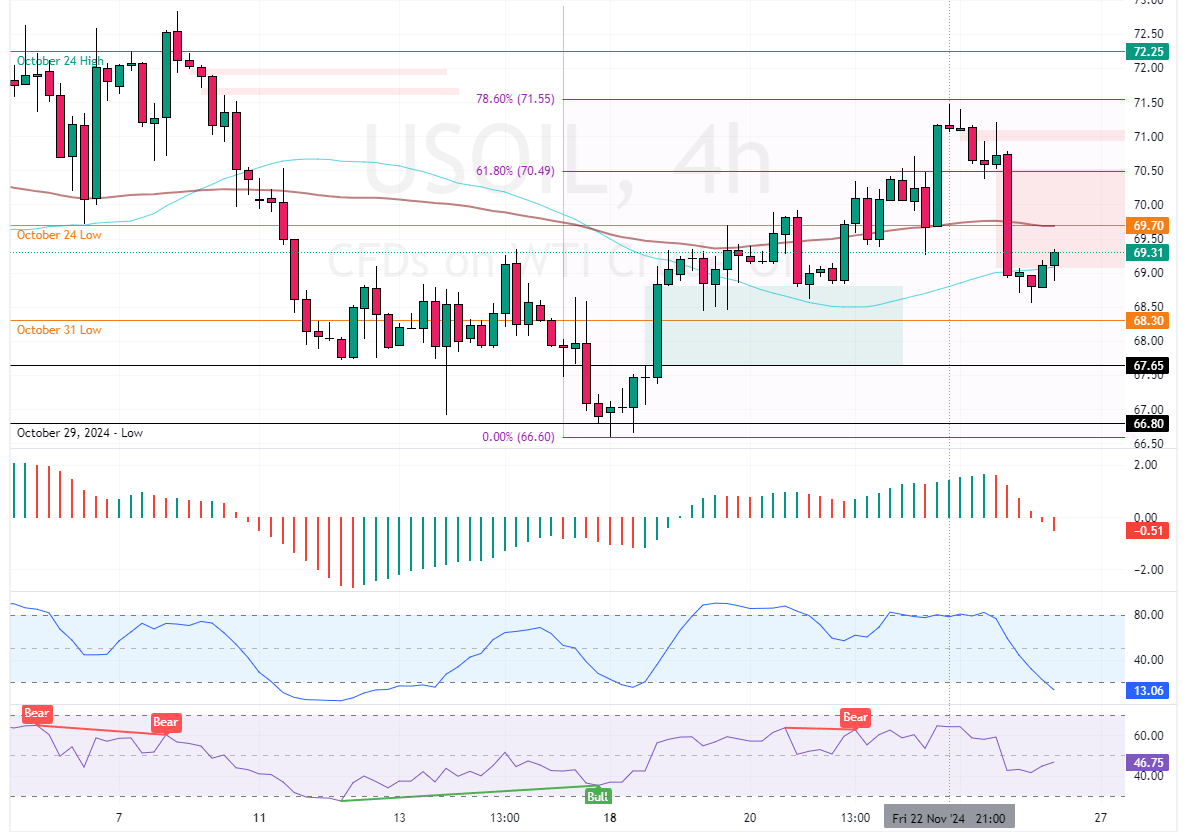
FxNews—WTI Crude Oil prices fell from $71.5 to 78.6% Fibonacci resistance on Friday, November 22. This decline was due to reports that Lebanon and Israel might be close to a deal to ease tensions with Hezbollah, reducing worries about possible disruptions in Middle East oil supplies.
On Monday, an Israeli official hinted that an agreement could be reached “within days,” but it’s still uncertain if all parties will agree to a truce. As of this writing, the black commodity trades at approximately $69.0, testing the bearish fair value gap area.

How US Tariff and Global Tensions Affect Oil Prices
Oil prices also faced pressure from a stronger US dollar, influenced by trade tensions after the government hinted at tariffs on countries like Canada, Mexico, and China. However, rising tensions between Russia and Ukraine and Iran’s plans to boost nuclear fuel production have supported oil prices, preventing further declines.
Traders are now focusing on the upcoming OPEC meeting on December 1 for more insights into the market’s direction.
Technical Analysis – $68.3 Crucial for Oil’s Next Move

The recent selling pressure resulted in the momentum indicators hinting at an oversold market, as Stochastic records show 12 in the description. However, the primary trend should be considered bearish because Oil prices dipped below the 100-period simple moving average.
The immediate support is at $68.3, the October 31 low. From a technical perspective, the downtrend could resume if bears push the WTI crude prices below the immediate resistance. In this scenario, the next bearish target could be $67.6, backed by the bullish fair value gap. Furthermore, if the selling push prices below $67.6, the bears’ path to the October 29 low at $66.8 will likely be paved.
The Bullish Scenario
Please note that the bearish outlook should be invalidated if Oil prices exceed the immediate resistance at $70.5. If this scenario unfolds, the trend should be considered reversed from bearish to bullish, targeting $71.5.