FxNews—Silver price bounced from $27.7 in today’s trading session as expected, mainly because the price had significantly declined on Friday, and a short consolidation phase was on the horizon.
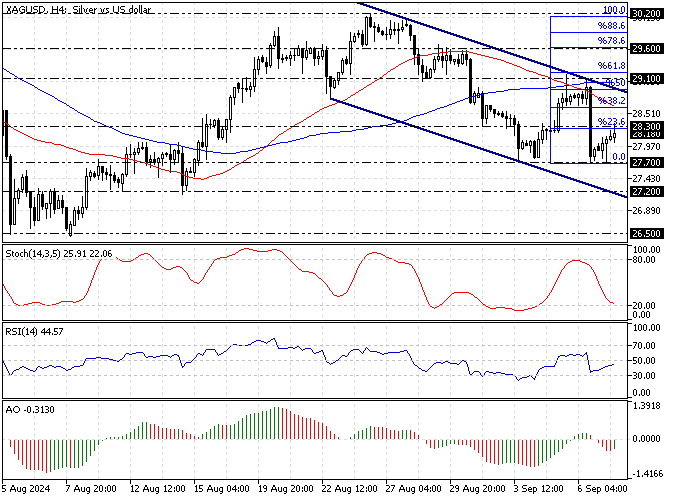
The XAG/USD 4-hour chart below demonstrates the price, key Fibonacci levels, and indicators used in today’s silver technical analysis.

Silver Technical Analysis – 9-September-2024
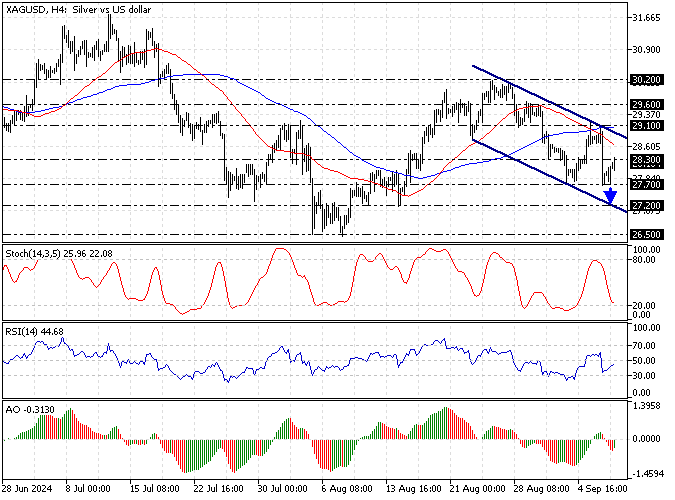
As of this writing, the precious metal tested the September 2 low at $28.3. Interestingly, the price is below the 50- and 100-period simple moving averages. Furthermore, the price descends inside the bearish flag, another sign of a downtrend.
- The stochastic oscillator depicts 24 in the %K line, meaning the market could become oversold soon.
- The relative strength index indicator gives a mixed signal. The indicator shows 41 in the description and is ascending. This development in RSI (14) suggests the bull market is strengthening.

On the other hand, the Awesome oscillator shows a divergence in its histogram. The bars are below the signal line, and the recent bar turned green. This development in the AO histogram signifies that the trend can potentially reverse from a bear market to a bull market.
Overall, the technical indicators in the Silver 4-hour chart suggest the primary trend is bearish, but the price can potentially rise to target the upper resistance levels.
Silver Forecast – 9-September-2024

The main trend is bearish, and the immediate resistance rests at $27.7 (September 03 Low). From a technical perspective, Silver’s downtrend will likely be triggered if the bears (sellers) close and stabilize the price below $27.7.
If this scenario unfolds, the bearish wave that initiated from $29.1 (September 05 High) will likely extend to $27.2 (August 14 Low). Furthermore, if the selling pressure exceeds $27.2, the next supply zone will be the August 2024 all-time low at $26.5.
Silver Bullish Scenario – 9-September-2024
The September 5 high at $29.1, which coincides with the 100-period simple moving average, is the primary resistance to the current consolidation phase. If the bulls (buyers) close and stabilize the price above $29.1, the bulls’ path to $29.6 (August 29 High) will likely be paved.
That said, if the buying pressure exceeds $29.6, the next resistance area will be the August 2024 all-time high at $30.2. Please note that the 100-period SMA will play the primary role in supporting the bullish scenario.
Silver Support and Resistance Levels – 9-September-2024
Traders and investors should closely monitor the key levels below to make informed decisions and adjust their strategies accordingly as market conditions shift.
- Support: $27.7 / $27.2 / $26.5
- Resistance: $28.3 / $29.1 / $29.6 / $30.2
Disclaimer: This technical analysis is for informational purposes only. Past performance is not necessarily indicative of future results. Foreign exchange trading carries significant risks and may not be suitable for all investors. Always conduct your research before making any investment decisions.