...

Silver Technical Analysis – Bearish Signal Decoded

FxNews—In today’s silver technical analysis, we observe a bearish long-wick candlestick pattern that emerged when the market reached the upper band of the bearish flag on the daily chart. Since then, the silver price has fluctuated between the 78.6% and 61.8% Fibonacci retracement levels. The Awesome Oscillator’s histogram turning red further supports the recent correction in the XAG/USD price.

Silver Technical Analysis – Bearish Signal Decoded
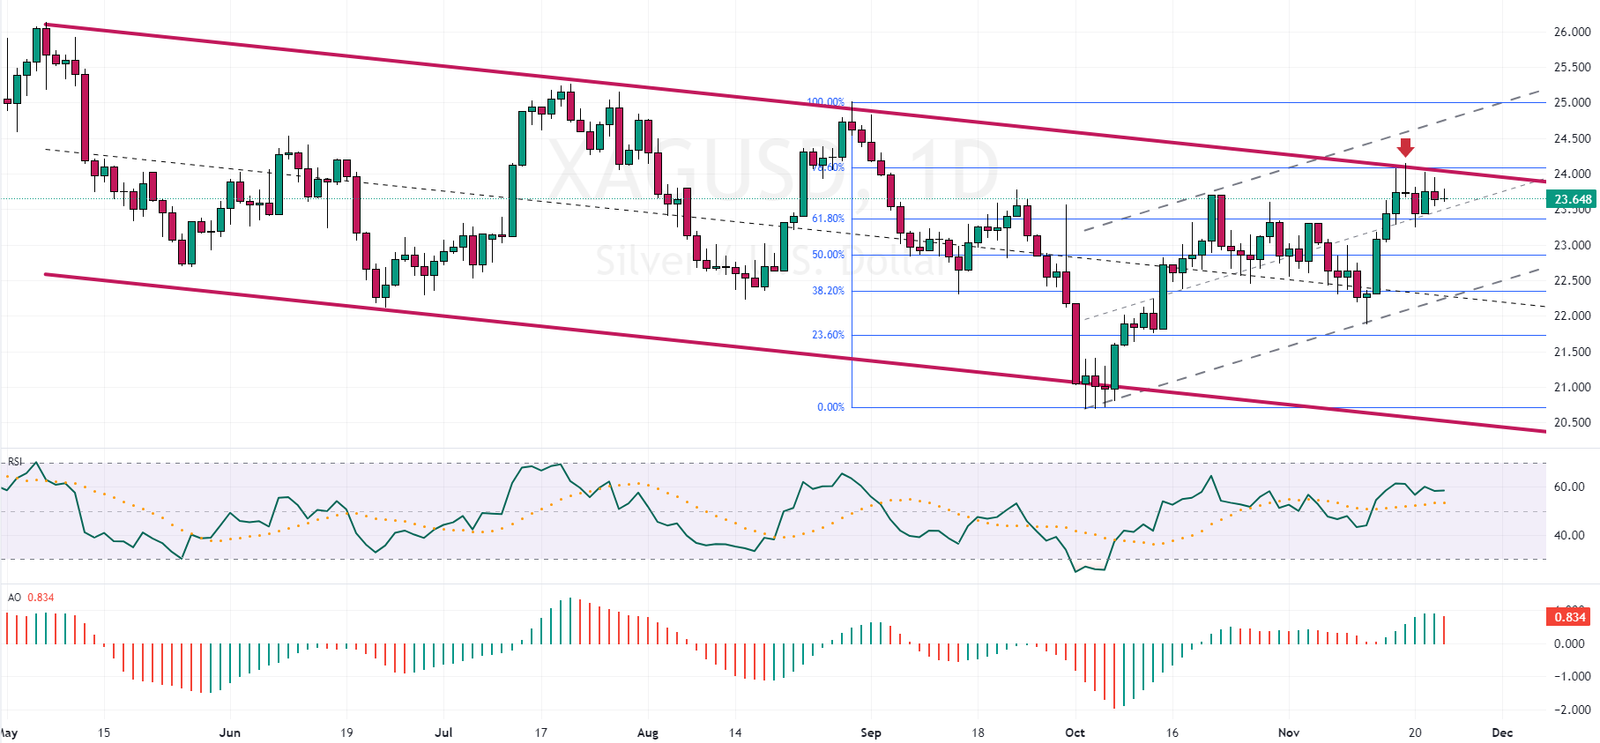
Silver Technical Analysis - Bearish Signal Decoded
Silver Technical Analysis – Bearish Signal Decoded – Daily Chart

We’ll examine the lower time frames to understand the silver technical analysis better. On the 4-hour chart, another bearish signal emerges, a bearish engulfing candlestick pattern. The Awesome Oscillator supports this bearish outlook by crossing below the signal line.

Silver Technical Analysis - Bearish Signal Decoded
Silver Technical Analysis – Bearish Signal Decoded – 4H Chart

The $23.4 support level plays a pivotal role, as bears failed to stabilize the price below this mark in the previous trading session. Should this level be breached, the decline that began last Friday could initially target the $23 threshold, coinciding with the 50% Fibonacci retracement level.

Our bearish outlook in silver technical analysis hinges on the price remaining below $24.1. A break above this level would invalidate the current bearish scenario.

Latest Posts

Bitcoin Analysis: Technical, Fundamental & News

Discover the latest Bitcoin analysis with our expert insights....

EURUSD Analysis: Technical, Fundamental & News

Discover the latest EURUSD analysis with our expert insights....

EURUSD began consolidating from 1.017: rose 0.85%

EURUSD began consolidating from 1.017 and rose 0.85%, trading...

Litecoin Gained 7.1%: What’s the Next Target?

Litecoin gained 7.1%, marching slowly toward $100.0. The uptrend...

GBPJPY consolidates at 192.2: Up By 1.2%

GBPJPY consolidates at 192.2, having gained 1.2% since January...

Gold Exceeded $2665: Now Overbought!

Gold exceeded $2665 resistance. However, robust buying pressure made...

Bullish Symmetrical Triangle Signals NATGAS Breakout

NATGAS trades sideways in a low-momentum market inside the...

Crude Oil Holds at $72.8 After Initial Price Dip

Crude Oil price dipped from $75.24, testing the %50.0...

Gold Stays Below $2665 Ahead of US Economic Data

On Monday, the price of gold remained below $2,665...

US Gasoline Futures Hit $2.07 Amid Oil Surge Amid Oil Surge

Gasoline futures in the US have climbed past $2.03...

NATGAS Dips 14% Amid Low Storage Draws

Natural gas prices in the U.S. fell sharply by...

WTI Crude Slips From $74 as Dollar Strengthens

Crude oil prices for West Texas Intermediate (WTI) dipped...

NATGAS is Hit $4 As the Year Ends

NATGAS hit $4.0, trading in a robust uptrend. The...