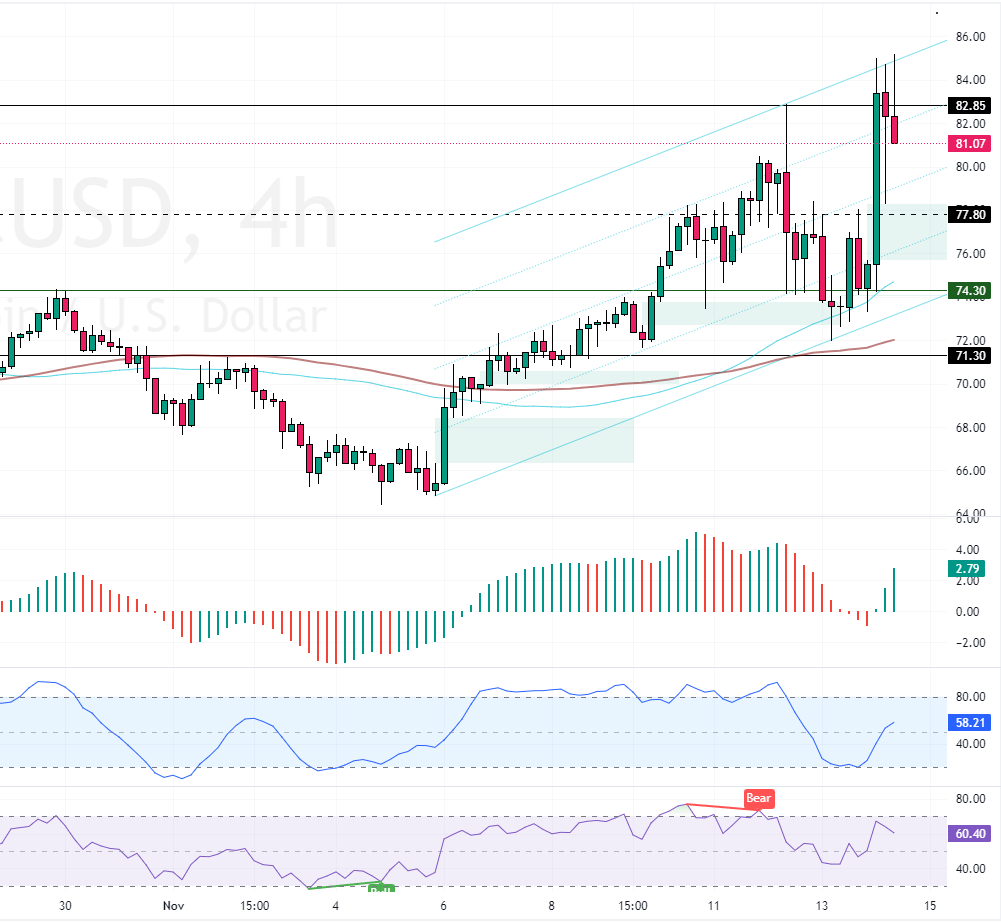
FxNews—Litecoin prices reacted negatively to the upper line of the bullish channel and dipped from an almost $86 high. As of this writing, the cryptocurrency in discussion trades at approximately $81.6.

Litecoin Technical Analysis
The LTC/USD primary trend should be considered bullish because the prices are above the 50-period simple moving average. As for the technical indicators, we notice that RSI and Stochastic depict 62 and 59 in the description, meaning the market is not overbought.
Meanwhile, this week, the Awesome Oscillator histogram shifted above the signal line, indicating the bull market should prevail.
Overall, the technical indicators suggest the primary trend is bullish and should resume.
Litecoin Price Forecast

The November 11 high at $80.4 is the immediate support. From a technical perspective, the trend outlook remains bullish as long as the price is above the support. In this scenario, we expect Litecoin to continue its bullish trajectory, with the next bullish target at $90 (May 21 High).
Conversely, a new consolidation phase could emerge if bears push the Litcoin prices below the immediate support. If this scenario unfolds, today’s downtick momentum can potentially extend to $78.3. Furthermore, if the selling pressure exceeds $78.3, the next bearish target could be the October 29 high at $74.3.
- Support: 80.4 / 78.3 / 74.3
- Resistance: 82.85 / 86.0 / 90.0