FxNews – The patterns on a forex chart can hint at where prices might go next. One helpful hint is the “Reverse Head and Shoulders Pattern.” Just like it sounds, this pattern looks a bit like an upside-down normal head and shoulders pattern, suggesting that prices might start climbing.
In this article, we’ll explore this simple yet powerful tool, making it easy for everyone to understand and use.
What’s Reverse Head and Shoulders All About?
Imagine drawing a person standing on their head. That’s kind of what the Inverted Head and Shoulders look like:
- Left Shoulder: They bounce back up a little after prices drop slightly. This first dip is the left Shoulder.
- Head: Prices drop even lower this time (the deepest dip), and then they climb back up. This lowest point is the head.
- Right Shoulder: Prices dip again, but not as deep as the head, and then rise. This is the right Shoulder.
- Neckline: Draw a line connecting the high points after the left shoulder and head. This is your neckline, and it’s an important line to watch!
How Do We Use Reverse Head and Shoulders Pattern for Trading?
Once you spot this upside-down person on the chart, here’s a simple guide:
- Wait for a Sign: The real deal is when prices go above the neckline and stay there. Until then, it’s just a possible hint.
- Time to Buy: If prices stay above the neckline, it’s often a good sign to buy, as one expects prices to keep increasing.
- Safety First: Set a point (below the right Shoulder) to sell if things don’t go as planned. This step helps limit losses.
- Setting Goals: Measure the distance from the head’s bottom to the neckline. This can help guess how much prices might rise.
Real Example for Reverse Head and Shoulders Pattern
Let’s use the US Dollar (USD) and Swiss Franc (CHF) pair (USD/CHF) as a sample.

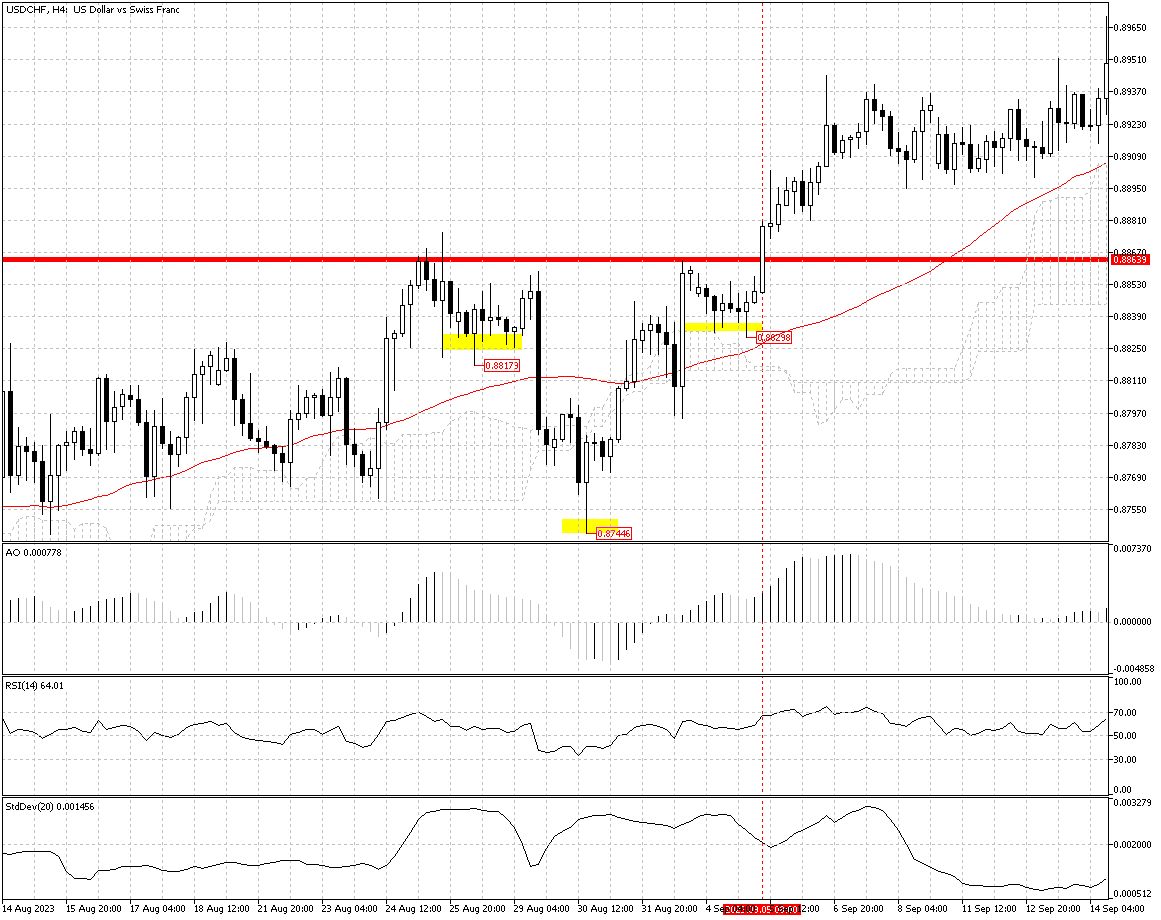
The USDCHF 4-hour chart above is an excellent example of how reverse head and shoulder patterns can ease technical analysis in the forex market.
- The left shoulder low is at 0.8817
- The right shoulder low is at 0.829, slightly above the left shoulder.
- The head is the lowest in the chart and is at the 0.8744 mark.
- The neckline is the highest point after the head, at the 0.8863 mark.
In this reverse head and shoulder analysis, the trend was bearish until the U.S. Dollar broke out the neckline (0.8863) on March 5th, and as a result, the trend reversed from a bear market to a bull market.
Things to Remember
This pattern is handy, but it’s not magic. Keep these in mind:
- Watch Out for False Hints: Prices might briefly go above the neckline and then dip back down. It can be misleading.
- It’s Not Always Perfect: Even after all signs point to rising prices, things can change. News events or other unexpected happenings can affect prices.
Using other tools alongside the Inverted Head and Shoulders can help confirm your decisions and make your trades more secure.
Wrap-Up
The Inverted Head and Shoulders pattern is like a friendly hint from the market, suggesting that prices might rise. It’s a great tool in your trading toolkit, especially when paired with other tools and strategies. Happy trading!