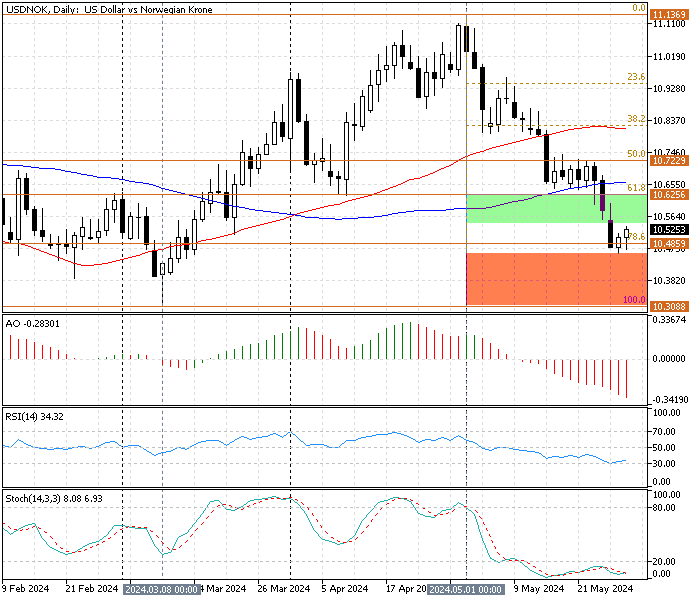
FxNews—The U.S. Dollar is in a downtrend against the Norwegian Krone. The USD/NOK currency pair is pulling back from the 78.6% Fibonacci support level at $10.48, currently trading at about $10.52.
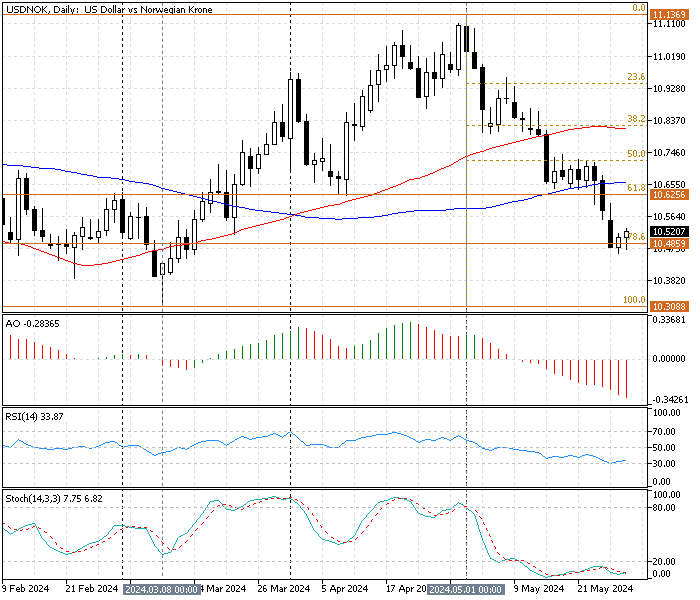
The daily chart above shows the relevant Fibonacci retracement levels drawn from the March 8 low at $10.30 to May’s all-time high at $11.13. The downtrend began at $11.13 and is currently slowed down at 23.6% Fibonacci, as mentioned earlier.
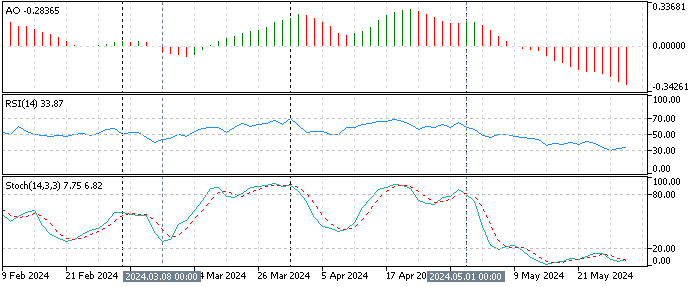
The technical indicators in the daily chart provide exciting information.
- The awesome oscillator value is -0.28 and declining; the bars are red, below zero, suggesting a strong downtrend.
- The relative strength index indicator value is 33 and on the rise, indicating the bearish momentum tires.
- The stochastic oscillator is in oversold territory, reading 7 in the description, which indicates that the USD/NOK is extremely oversold. Hence, if it rises to an upper resistance level, the trend might reverse or consolidate.
These developments in the technical indicators in the daily chart suggest the primary trend is bearish, but the trend is losing momentum, meaning a consolidation phase could be imminent.
We zoom into the USD/NOK 4-hour chart for a detailed analysis and find critical levels and trading opportunities.
USD/NOK Technical Analysis 4-Hour Chart
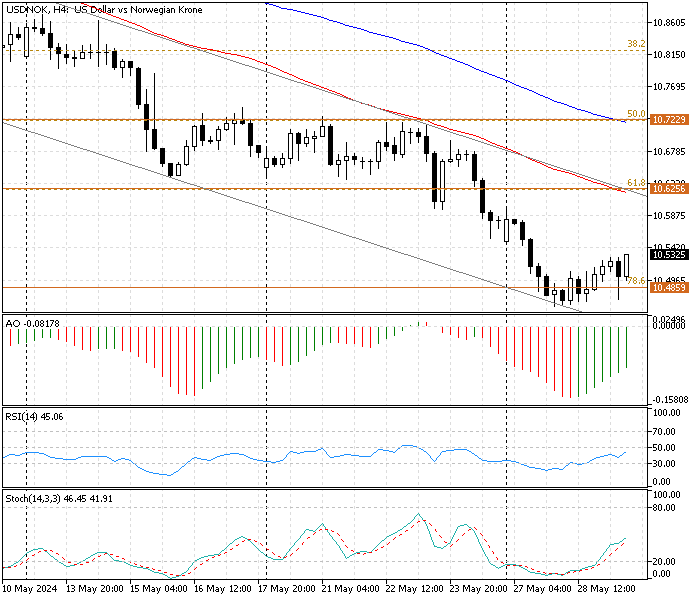
The 4-hour chart shows the USD/NOK price trading inside the bearish flag, pulling back from the lower band. This supply level is connected with the 23.6% Fibonacci at $10.48.
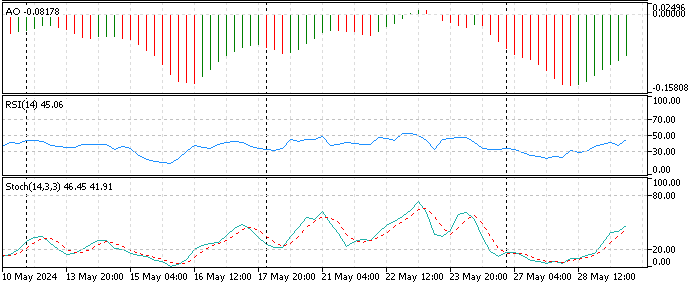
The technical indicators in the 4-hour chart provide the following information:
- The awesome oscillator value is rising, reading -0.08 in the description, suggesting the bearish momentum is fading.
- The RSI (14) depicts a value of 42 in the description, approaching the middle line, signaling that the bearish trend is weakening.
- The stochastic oscillator stepped out of the oversold territory with the %K line value at 42, suggesting the trend is neutral, but the price might rise further.
These developments in the technical indicators suggest the bearish primary trend is losing momentum, and the USD/NOK will likely initiate a correction phase toward the upper resistance level.
USD/NOK Forecast – May-29-204
From a technical standpoint, the primary trend is bearish, but the charts show signs of a weak bullish momentum. Referring to the robustness of the downtrend, we suggest waiting patiently for the USD/NOK to go through the consolidation phase. In this case, the price of USD/NOK could rise to test the 61.8% Fibonacci retracement level at $10.62, a strong resistance powered by EMA 50 and the upper band of the bearish flag.
Therefore, traders and investors should monitor the key resistance level at $10.62 for bearish signals such as oversold stochastic, RSI, or candlestick patterns. If the crucial resistance level holds, the downtrend will likely continue, and the next bearish target could be set at the March all-time low of $10.30.
Bullish Scenario
Conversely, if the USD/NOK price crosses above the 61.8% Fibonacci level at $10.62, the current consolidation phase could extend to the 50% Fibonacci level at $10.72.
Notably, A break above $10.72 will signal a trend reversal from bearish to bullish.
USD/NOK Support and Resistance Levels
Traders and investors should closely monitor the below USD/NOK key levels to make informed decisions and adjust their strategies accordingly as market conditions shift.
- Support: $10.48, $10.30
- Resistance: $10.62, $10.72