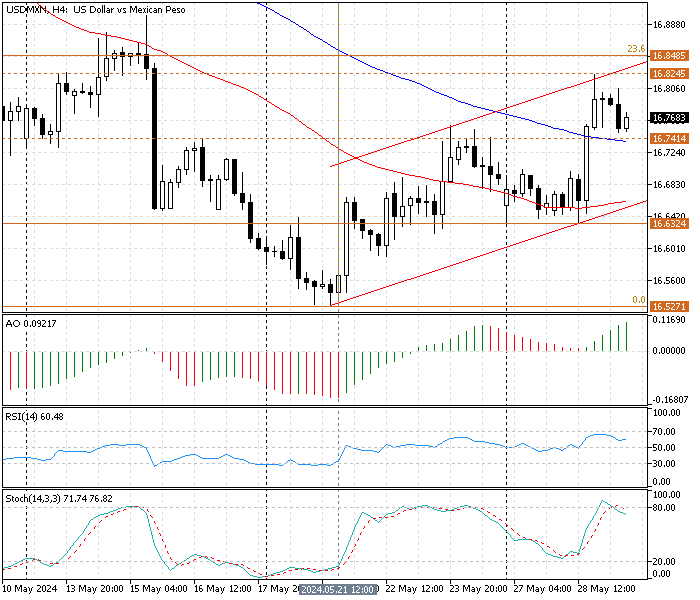
FxNews—The American dollar trades in a downtrend against the Mexican Peso at about $16.76. The primary trend is bearish, but the USD/MXN has been in a weak uptrend since May 21, ranging sideways inside a bullish flag.
USD/MXN Technical Analysis 4-Hour Chart

In yesterday’s trading session, the bulls crossed above the simple moving average 100. As a result, the USD/MXN price rose to the upper line of the bullish flag at $16.82, a resistance level slightly below the 23.6% Fibonacci retracement.

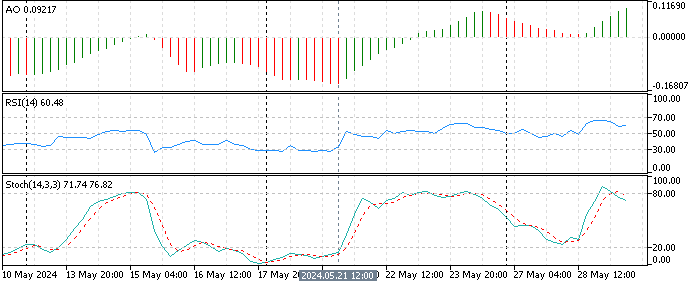
The technical indicators in the 4-hour chart provide exciting signals.
- The awesome oscillator depicts 0.09 in the description. The bars are green and above the zero line, meaning the bullish momentum accelerates after the SMA 50 breakout.
- The RSI indicator value is 61, above 50, and not overbought, suggesting the uptrend could resume.
- The stochastic oscillator is in oversold territory, with the %K line value at 72 and declining. This suggests that the USD/MXN’s current bullish momentum could slow down, or the trend could reverse from uptrend to downtrend from the $16.82 high.
These developments in the technical indicators in the 4-hour chart suggest that the uptrend momentum is gaining strength, but the market has reached a robust resistance level, the $23.6% Fibonacci level at $16.8.
USDMXN Forecast – May-29-2024

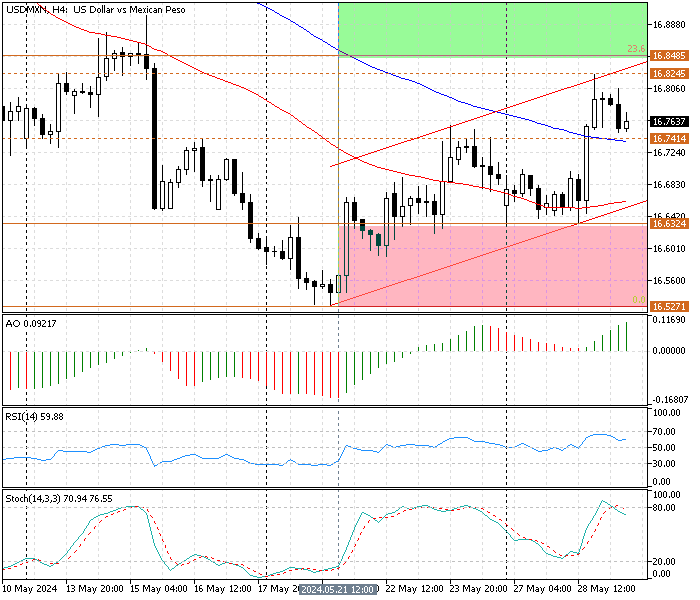
From a technical standpoint, the primary trend is bearish, but the currency pair demonstrates signs of bullish momentum. That said, if the U.S. Dollar maintains the exchange rate above the immediate support at $16.74, the uptick moment that began from $16.52 will likely resume. The first barrier is the immediate support at $16.82.
If the price closes and stabilizes above $16.82, the next support level will be the 38.2% Fibonacci at $17.04.
USD/MXN Bearish Scenario
The immediate support is at $16.74, aligning with the SMA 100. The bullish scenario should be invalidated if the USD/MXN price dips below $16.74. In this scenario, today’s decline from $16.82 could target the secondary resistance at $16.63, followed by the May 21 low at $16.52.
USD/MXN Support and Resistance Levels
Traders and investors should closely monitor the key levels below to make informed decisions and adjust their strategies accordingly as market conditions shift.
- Support: $16.74, $16.63, $16.52
- Resistance: $16.82, $17.04
Disclaimer: This technical analysis is for informational purposes only. Past performance is not necessarily indicative of future results. Foreign exchange trading carries significant risks and may not be suitable for all investors. Always conduct your research before making any investment decisions.