FxNews—The U.S. Dollar’s decline against the Polish Zloty from April’s high of $4.123 eased near the 2023 all-time low of $3.9. As of writing, the USD/PLN currency pair trades at about $3.92.
USD/PLN Technical Analysis Daily Chart
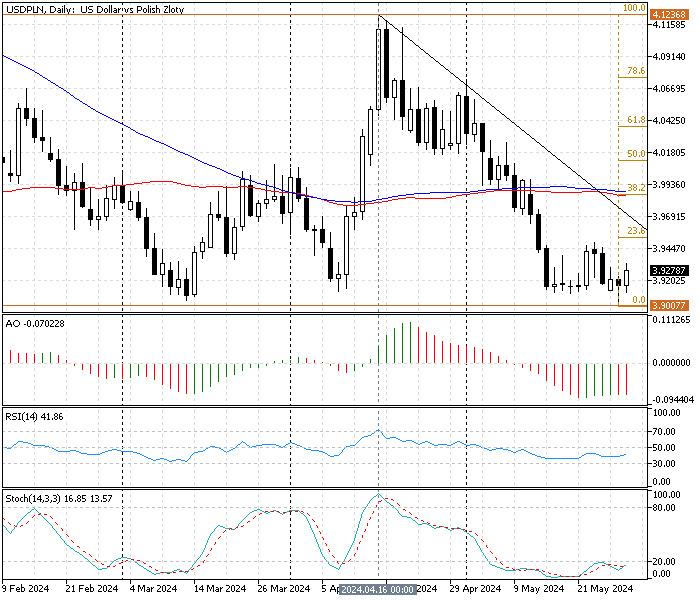
The daily chart above shows the pair formed multiple Doji and a hammer candlestick pattern at the $3.9 psychological resistance. This indicates that the bearish trend is tired and might consolidate or reverse from a bear to a bull market.
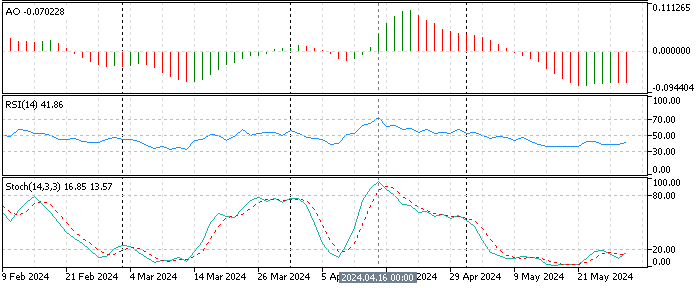
The technical indicators in the daily chart provide valuable information explained below:
- The awesome oscillator bars are red, below zero, reading -0.07 in the description. This means the bearish trend prevails.
- The relative strength index indicator floats alongside the median line with a value of 41, suggesting uncertainty in the market. This signal aligns with the candlestick patterns from the daily chart, signifying the downtrend might soon consolidate to higher resistance levels.
- The stochastic oscillator has been in oversold territory since April 30, showing that the market is oversold. However, it will likely start the consolidation phase, or the trend might flip from bearish to bullish.
These developments in the technical indicators in the daily chart suggest the market is bearish, but the U.S. Dollar might erase some of its recent losses against the Polish Zloty. Hence, we zoom into the USD/PLN 4-hour chart for a detailed analysis and to find key levels and trading opportunities.
USD/PLN Technical Analysis 4-Hour Chart
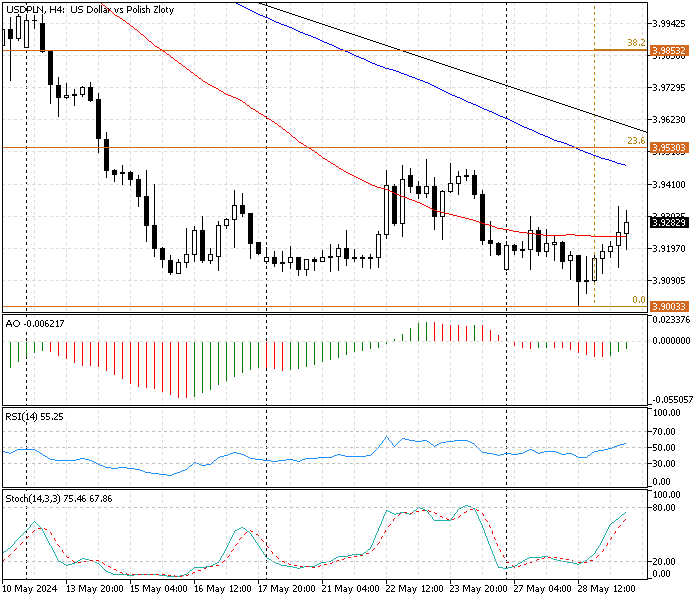
The 4-hour chart above demonstrates weak bullish momentum in the price. The bounce from the $3.90 psychological level resulted in the closing above the simple moving average of 50.
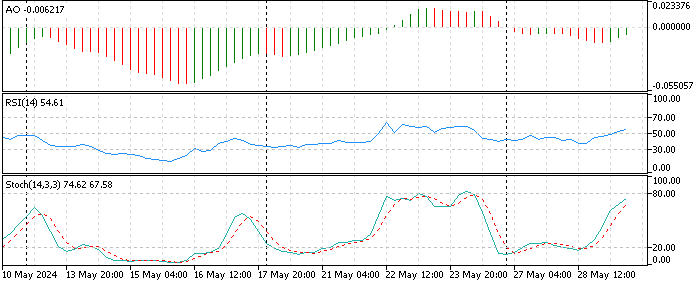
The technical indicators in the 4-hour chart give the following information:
- The awesome oscillator signals divergence. The bars are green, showing a value of -0.006 in the description. This development in the AO suggests a bullish wave could be on its way.
- The RSI (14) has flipped above the median line, showing 54 in value, promoting the bullish momentum.
- The stochastic oscillator %K line is nearing overbought territory, reading 74, which suggests the currency pair’s uptick momentum might cool down.
These developments in the technical indicators in the 4-hour chart suggest the USD/PLN price pullback from the psychological might soon lose momentum near the immediate resistance at $3.953.
USD/PLN Forecast – May-29-2024
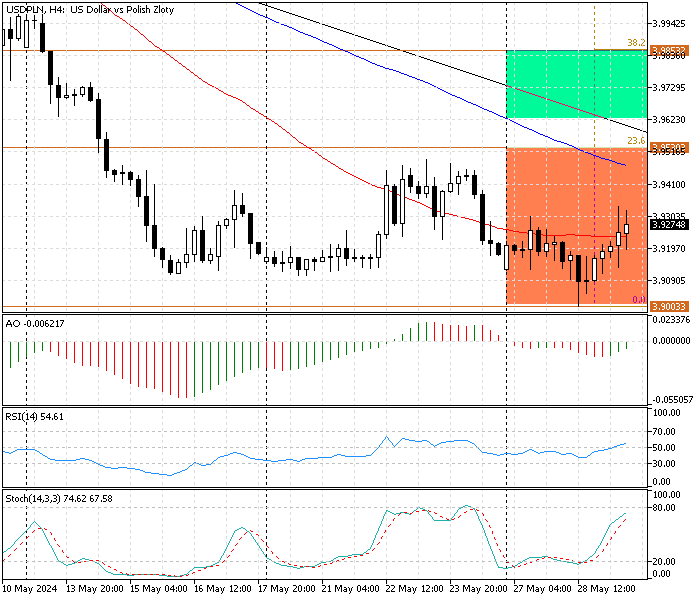
From a technical perspective, the USD/PLN currency pair is in a strong downtrend, but the bearish momentum eased near the psychological resistance level at $3.90. With this outlook, the U.S. Dollar will likely test the immediate resistance at $3.953, a robust demand area backed by SMA 100, the descending trendline, and the 23.6% Fibonacci.
Traders and investors should closely monitor the $3.953 resistance level for a bearish signal or bullish breakout.
If the USD/PLN price maintains its position below the descending trendline at $3.953, the downtrend will likely resume, starting with aiming for a break below the psychological level at $3.90.
USD/PLN Bullish Scenario
Conversely, today’s consolidation phase could extend to the 38.2% Fibonacci retracement level if the bulls close and stabilize the U.S. Dollar exchange rate above the $3.953 key resistance against the Polish Zloty.
USD/PLN Key Support and Resistance Levels
Traders and investors should closely monitor the key levels below to make informed decisions and adjust their strategies accordingly as market conditions shift.
- Support: $3.90
- Resistance: $3.953, $3.985
Disclaimer: This technical analysis is for informational purposes only. Past performance is not necessarily indicative of future results. Foreign exchange trading carries significant risks and may not be suitable for all investors. Always conduct your research before making any investment decisions.

J.J Edwards is a finance expert with 15+ years in forex, hedge funds, trading systems, and market analysis.

