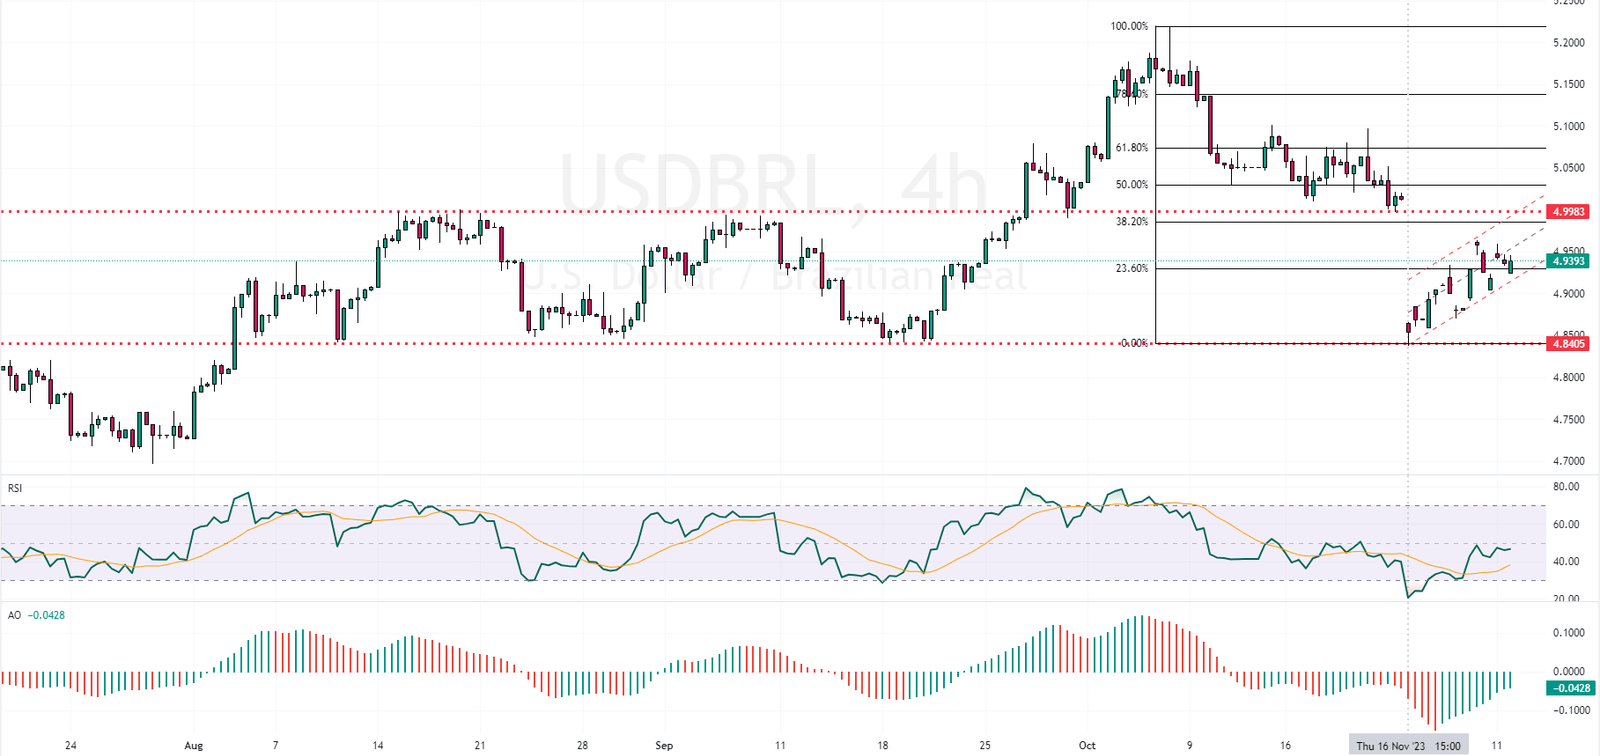
The USDBRL currency pair has stabilized its price above the 23.6% Fibonacci support level, indicating a bullish momentum. This is particularly evident in the USDBRL price movement within the flag pattern.
USDBRL Technical Analysis and Forecast
The RSI indicator is approaching the median line, further supporting the upward trend. Complementing these indicators, the Awesome Oscillator bars are predominantly green. These indicators signal strength in the current bullish wave that began on November 16. The bullish wave has the potential to extend towards the 38.2% Fibonacci resistance level.
However, this bullish outlook could be negated if the bears push the price below 23.6%.

Brazil Inflation Rate Drops
Bloomberg—In November 2023, Brazil’s Inflation Rate decreased to 4.68% from 4.82% recorded in the previous month. This change closely aligns with market expectations, which had forecasted an inflation rate of around 4.7%. This marks a continuation of the slowing inflation trend that began after reaching a seven-month high in September. Notably, this reduction brings the headline inflation rate closer to the upper limit of the central bank’s target range, 4.75%.
Economic Implications
This decrease in inflation is seen as a positive sign for Brazil’s economy, as it suggests a stabilization of prices, making it more manageable for consumers and businesses. The central bank will likely consider this trend in its upcoming meeting, potentially extending its cutting rate cycle to stimulate economic growth.
Regarding specific categories, transportation costs saw a notable slowdown, dropping from 7.44% in October to 6.85% in November. This was primarily influenced by the reduction in oil prices during the period, which consequently lowered motor fuel inflation from 13.27% to 7.93%. Although food and beverage prices slightly increased, from 0.48% to 0.57%, they remain below the year’s peak. Housing and utility costs remained relatively stable.
Every month, consumer prices experienced a marginal increase of 0.28%.