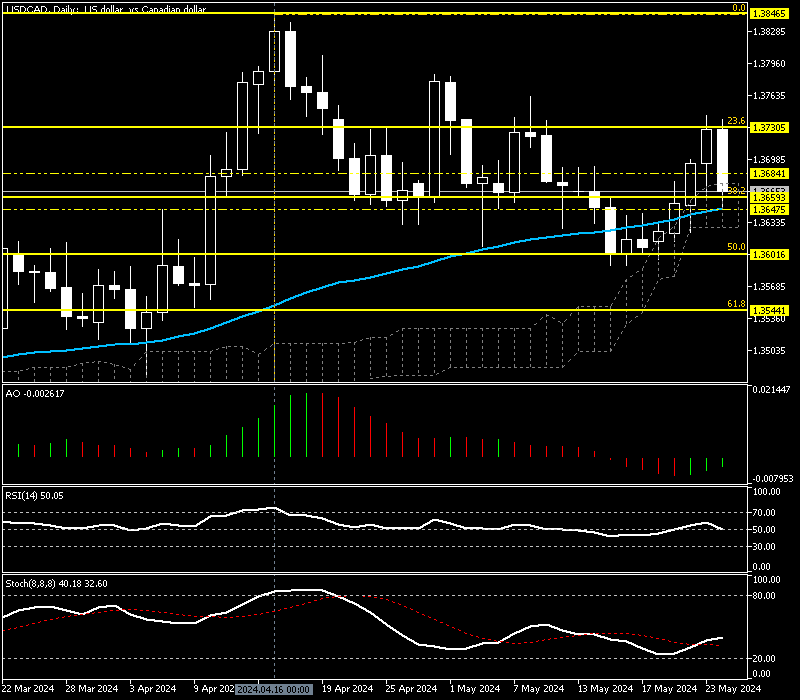
The American currency dipped against the Canadian dollar from a 23.6% Fibonacci retracement level at 1.373 on Friday. Consequently, the bears closed the week at the 1.366 mark.
USD/CAD Technical Analysis Daily Chart

The USD/CAD currency pair hovers above the Ichimoku cloud and EMA 50 in the daily chart, implying the primary trend is bullish. Since both these indicators are lagging, we zoom into the 4-hour chart to conduct a detailed analysis and find key levels and trading opportunities.
USD/CAD Technical Analysis 4-Hour Chart

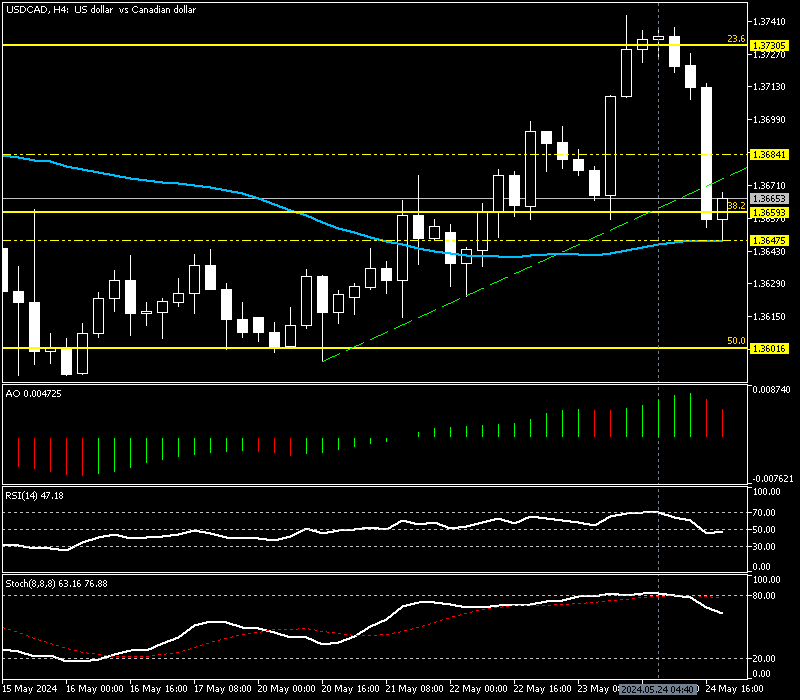
The currency pair bounced from the 4-hour chart EMA 50 at 1.364 and closed the trading session at 1.366. Interestingly, the bears closed below the ascending trendline, meaning the trend might reverse from a bull market to a bear market. The broken trendline is depicted in green in the image above.
- The awesome oscillator value is declining with red bars, showing a value of 0.0047 in the description. This development in the AO signifies the bearish pressure is gaining momentum.
- The Stochastic oscillator returned from overbought territory, recording 63 in the %K line, suggesting that bullish momentum is weakening and selling pressure is rising.
- The relative strength index aligns with the other oscillators, flipped below the 50 line, showing 47 in the description.
USDCAD Bearish Trend Hinges on EMA 50 Breakdown

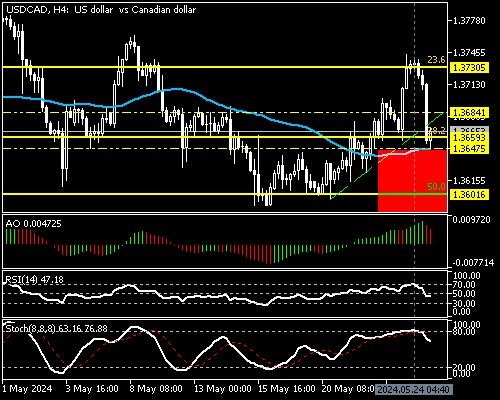
From a technical standpoint, for the bearish bias to resume, the USD/CAD price should close and stabilize below EMA 50 (4-hour chart) at 1.364. If this scenario comes into play, the downtrend momentum beginning at 1.373 will likely extend to the 50% Fibonacci retracement level at 1.360.
Further pressure can result in the U.S. Dollar exchange rate falling to 61.8% Fibonacci at 1.354 against the Canadian dollar.
The USD/CAD Bullish Scenario

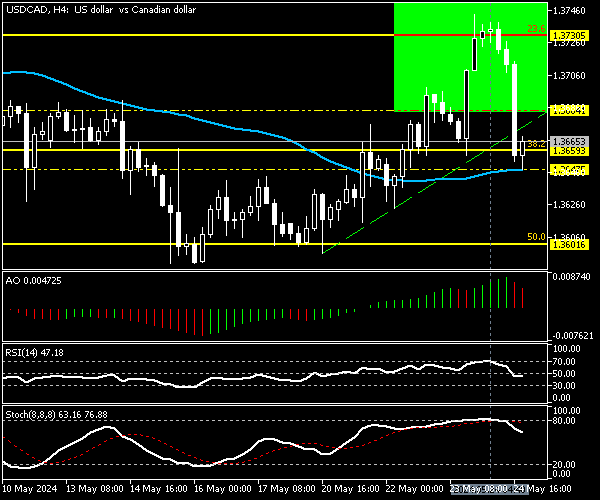
The immediate resistance is at 1.368. If the USD/CAD price rises above this level, the bearish trend should be invalidated. In this case, the pullback from EMA 50 can again target the May 24 high at 1.373.
USD/CAD Key Support and Resistance Levels
Traders and investors should closely monitor the USD/CADkey levels below to make informed decisions and adjust their strategies accordingly as market conditions shift.
- Support: 1.364, 1.360, 1.354
- Resistance: 1.368, 1.373