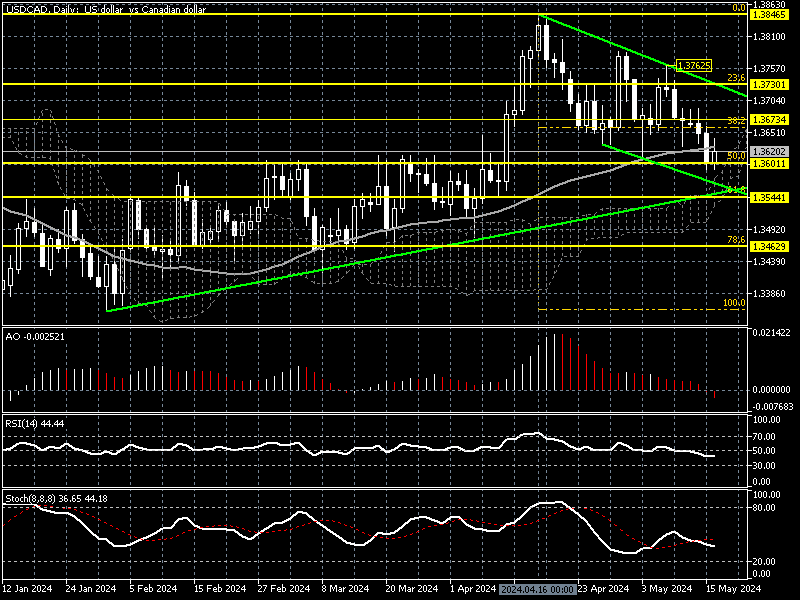
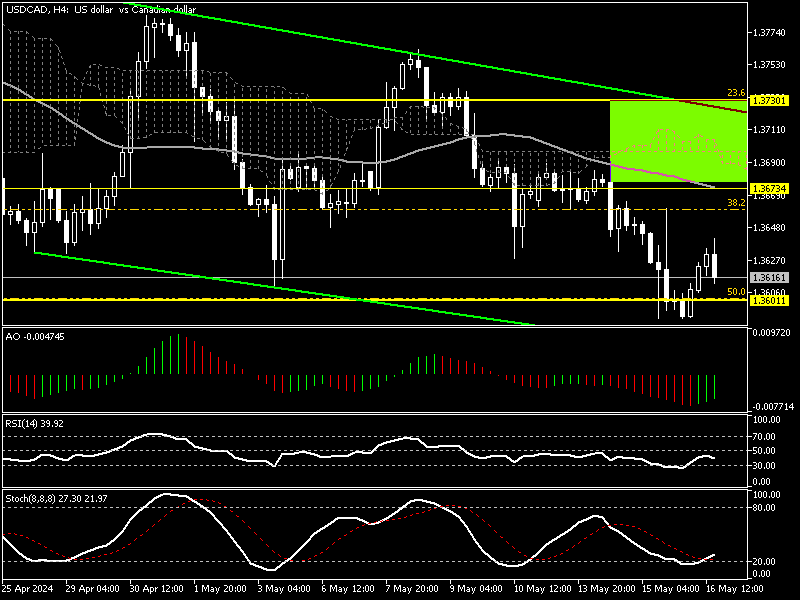
The U.S. Dollar trades at about 1.362 against the Canadian Dollar, which tested the 50% Fibonacci retracement level ($1.359) in today’s trading session.
USD/CAD Technical Analysis – Daily Chart

The USD/CAD Daily above shows the pair has been in an uptrend since late December 2023, but the market stepped into a consolidation phase after the price peaked at 1.384, the 2024 all-time high. As of this writing, the bears are trying to stabilize the price below EMA 50 (Daily Chart). Concurrently, the awesome oscillator and RSI align with the current moment, supporting the bearish bias.
The awesome oscillator flipped below the signal line today with red bars, and the relative strength index value is 44 below the median line.
These developments in the technical indicators suggest we are in a short-term downtrend because USD/CAD is still hovering above the Ichimoku Cloud (Daily Chart).
USD/CAD Technical Analysis – 4-hour Chart

We zoom into the USD/CAD 4-hour chart for a detailed analysis and find key levels and trading opportunities. This Chart provides us with interesting information and data.
The price is below EMA 50, indicating a short-term bearish trend. However, awesome oscillator bars turned green while approaching the signal line, and the stochastic oscillator stepped outside the oversold zone, showing a value of 21.
These developments in the technical indicators in the 4-hour Chart suggest that despite the selling pressure, the U.S. dollar might erase some of its recent losses against the Canadian currency.
USDCAD Downtrend – Will It Hit Fibonacci $1.354?

From a technical standpoint, the USD/CAD is in a short-term downtrend. If the price remains below EMA 50 in the 4-hour Chart, the selling pressure could lead the Canadian dollar to visit the lower line of the descending channel, followed by %61.8 Fibonacci ($1.354).
A breakdown below $1.354 could target the February low at about $1.346, a level of support backed by 78.6% Fibonacci.
USD/CAD Bullish Scenario

The $1.367 resistance plays a pivotal role between the bear and bull markets. This barrier is supported by EMA 50 and the Ichimoku cloud in the 4-hour time frame. Therefore, for the short-term downtrend to end, the USD/CAD bulls must cross and stabilize the price above the resistance.
If this scenario comes into play, we could see a rise in price toward the immediate resistance at 1.373, a robust ceiling backed by the descending trendline and the 23.6% Fibonacci. A breakout above 1.373 could escalate the bullish momentum and target the next resistance at 1.376, followed by May’s all-time high, the 1.384 mark.