FxNews – In this comprehensive USDCAD market analysis, we delve into the intricacies of the USDCAD Daily, 4H, and 1H charts. We aim to provide you with an in-depth understanding of the current state of the USDCAD market analysis.

USDCAD Drops Below Key Channel Level
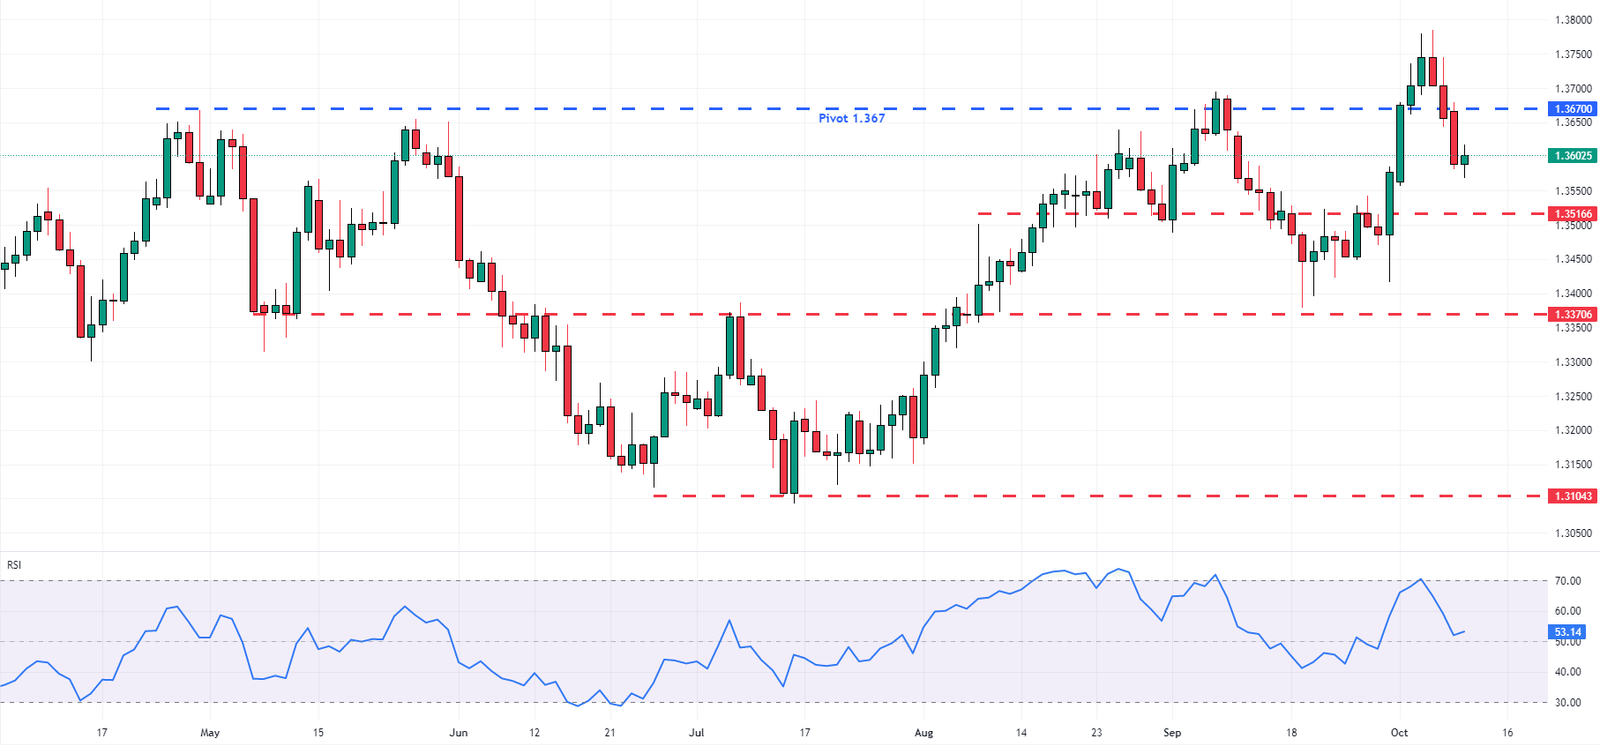
The USDCAD has seen a decline extending below the upward channel’s middle line. Interestingly, it tested this broken middle line in today’s session. The RSI indicator is on the verge of flipping below the 50 line, which indicates the strength of the bearish bias that began last week.

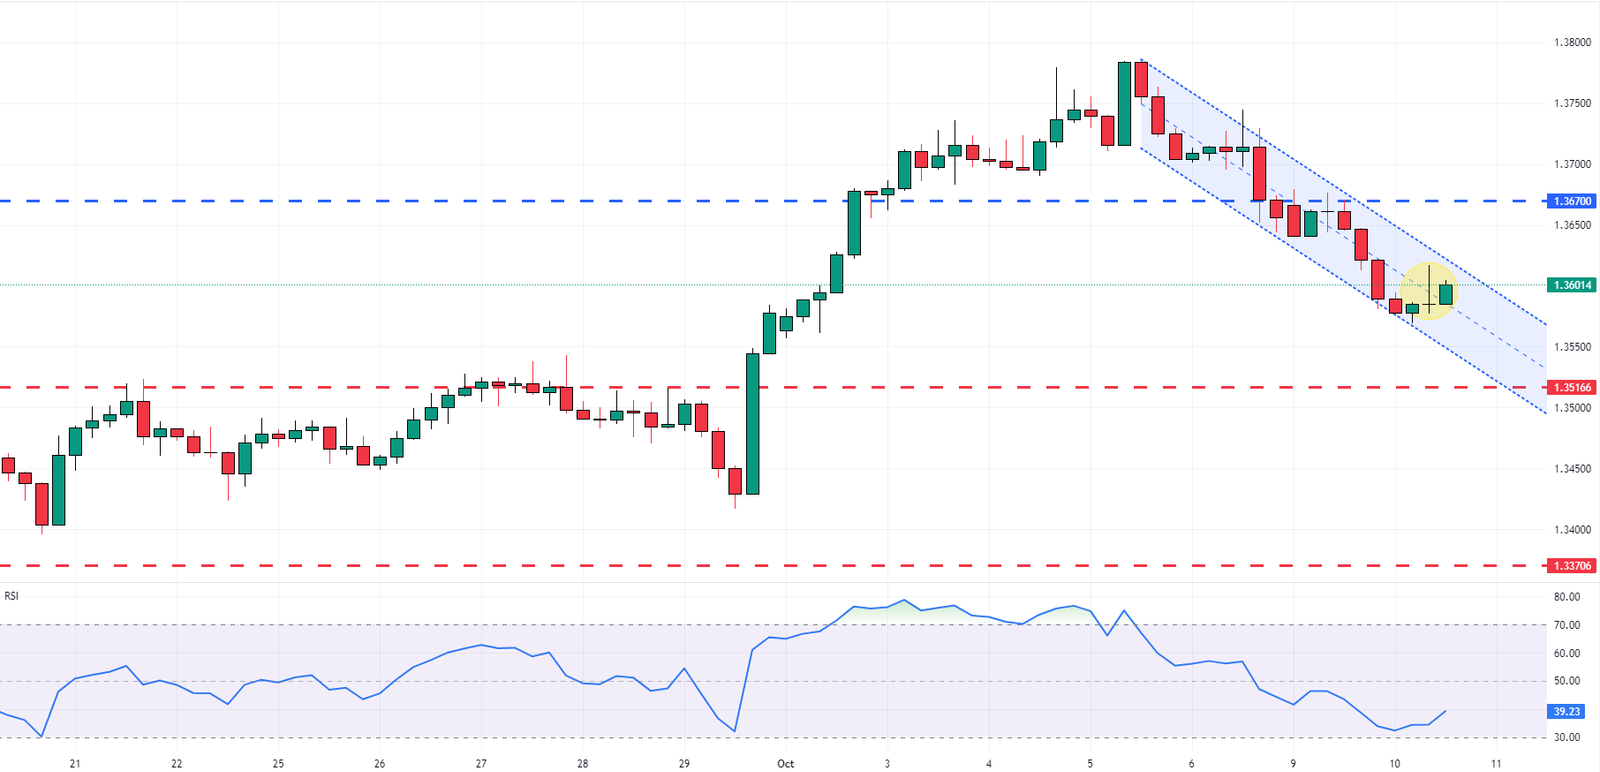
Looking at the 4H chart, we can gain a more detailed perspective of the USDCAD market analysis—the currency pair trades within a declining channel and above the 1.3516 support area. The RSI indicator is distancing itself from level 30.
However, there’s an element of uncertainty in the USDCAD market from a technical standpoint. This is evidenced by a long wick candlestick pattern in the 4H chart and almost a hammer candlestick pattern just a candle before, which emerged at the bottom of the declining channel.

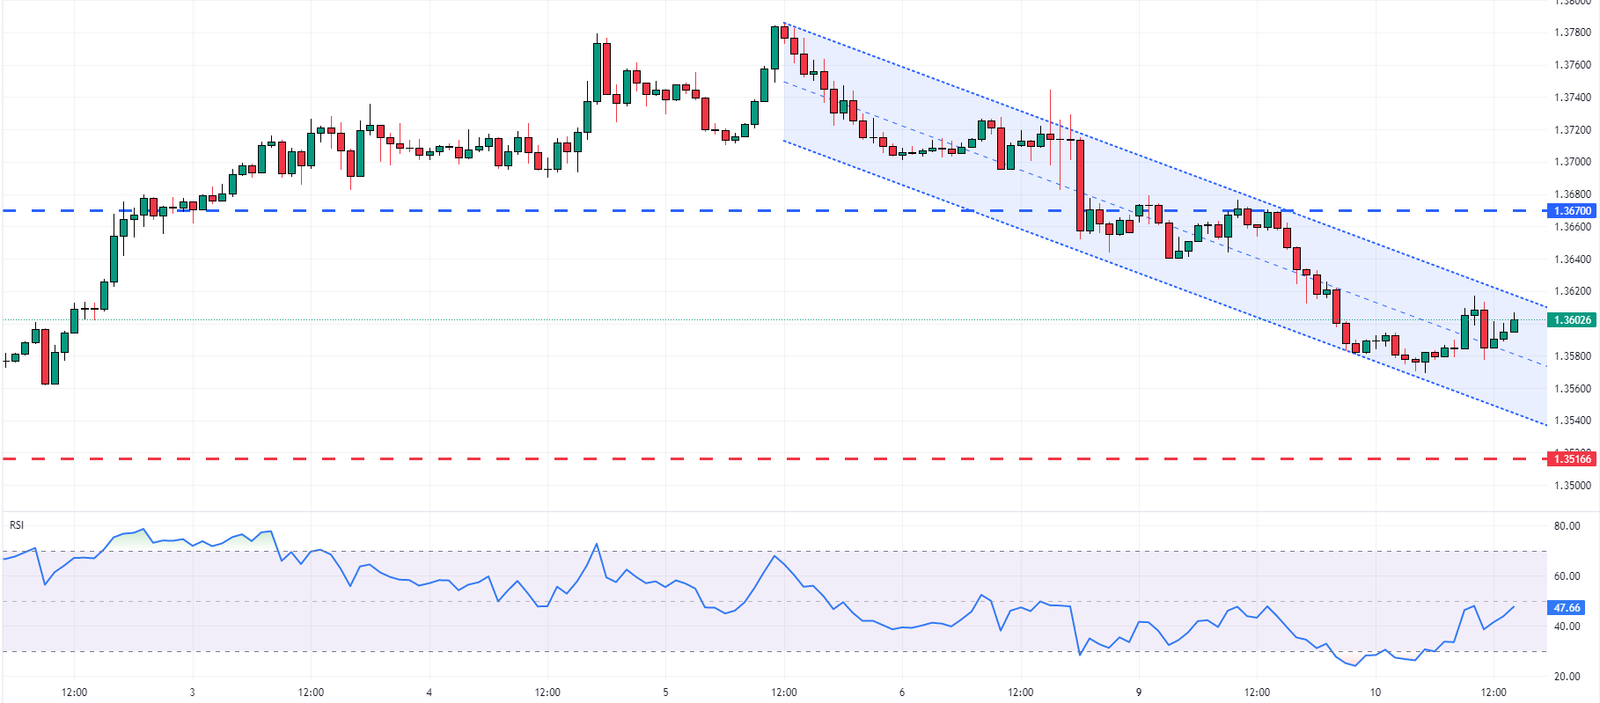
To better understand the USDCAD market analysis, we focus on the 1H chart. Here, we observe a bullish, engulfing candlestick pattern and the RSI indicator attempting to flip above the 50 line.
So far, in this USDCAD market analysis, we have gathered the following data:
- Daily Overview: Bearish
- 4H Overview: Uncertainty
- 1H Overview: Weak signs of bullish
USDCAD Market Analysis: Bullish Scenario
In conclusion, considering all factors mentioned in this technical analysis of USDCAD, we can propose two potential scenarios for this currency pair. The first scenario is bullish. In this case, bulls must close above the declining channel for a bullish outcome. If this happens, the pair could rise and test the broken pivot at 1.367.

Bearish Scenario and Trading Signal
On the other hand, if bulls fail to break through the channel and a long wick candlestick pattern or a bearish engulfing pattern forms, it would be advisable to enter a sell (short) position with risk around 1.363 and target at 1.3516 support area.
This trade would offer a risk/reward ratio of 1 to 4, a decent approach for today’s USDCAD market analysis.