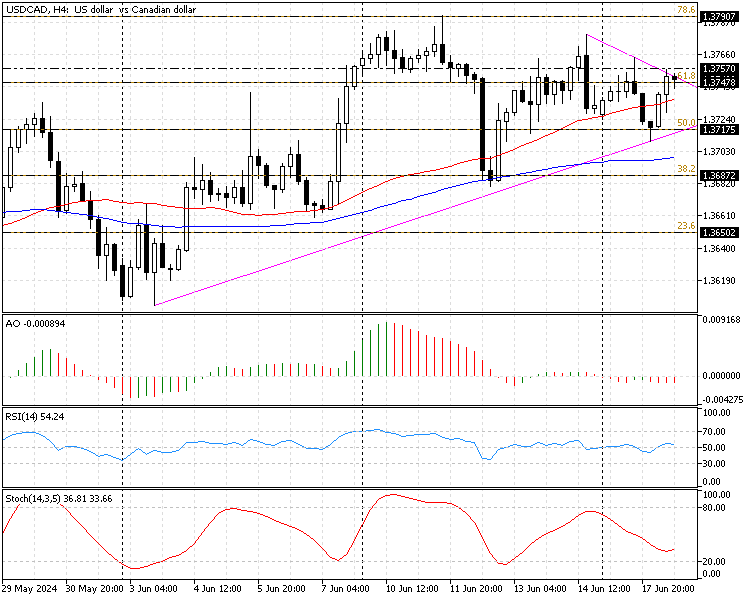
FxNews—The U.S. Dollar is in an uptrend against the Canadian dollar, trading at about 1.374 in today’s trading session. Currently, the USD/CAD currency pair tests the descending trendline and the 61.8% Fibonacci retracement level at 1.374.
The 4-hour chart below demonstrates today’s USD/CAD price, the Fibonacci levels, and the technical tools used in today’s analysis.

USDCAD Technical Analysis – 18-June-2024
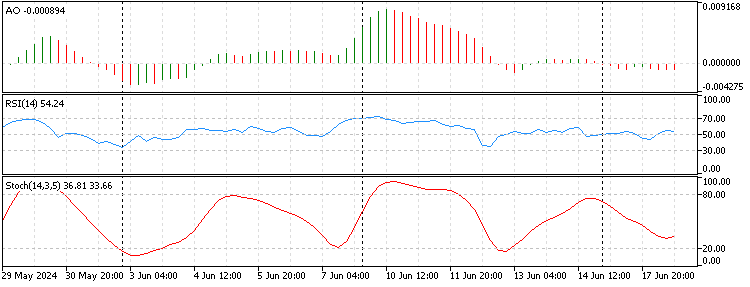
The technical indicators in the 4-hour chart suggest the USD/CAD primary trend is bullish, but currently, it lacks significant momentum and is trading sideways.

- The USD/CAD price is above the simple moving averages of 50 and 100, meaning the bullish trend prevails.
- The awesome oscillator indicator bars are small, red, and below zero, signifying the bullish momentum weakening.
- The relative strength index indicator hovers alongside the median line, showing 52 in the description, suggesting the market is moving sideways and has no significant trend.
- The stochastic oscillator value is 33, pointing to the fact that the market is not overbought or oversold.
USDCAD Price Forecast – 18-June-2024

Immediate resistance is at 1.375, slightly above the descending trendline and the 61.8% Fibonacci. The price is declining from the trendline at the moment, moving toward the apex of the symmetrical triangle.
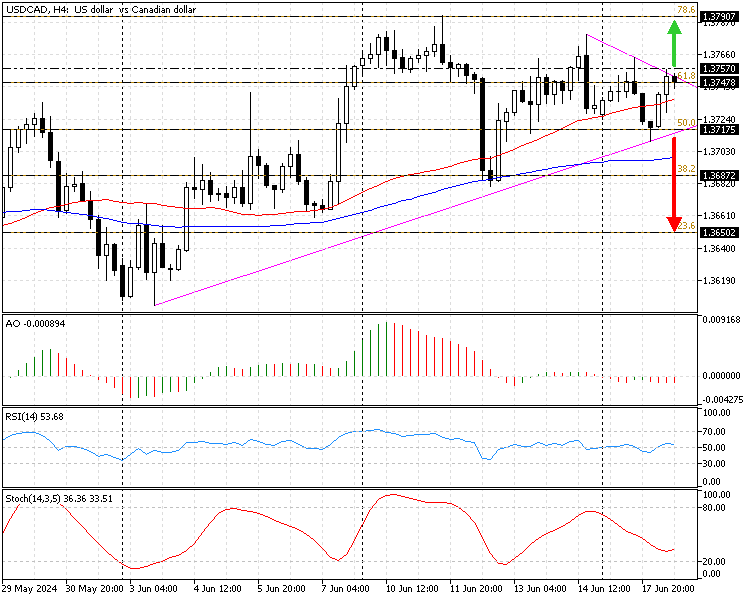
From a technical standpoint, for the primary trend to resume, bulls must close and stabilize the price above the immediate resistance at 1.375. If this scenario unfolds, the 78.6% Fibonacci at 1.379 will be the next resistance area. Furthermore, if the buying pressure exceeds 1.379, April’s all-time high at 1.384 will likely be tested again.
The ascending trendline and the %50 Fibonacci level at 1.371 support the bullish scenario. The bullish scenario should be invalidated if the USD/CAD price dips below 1.371.
USD/CAD Bearish Scenario
The key resistance level is at the 50% Fibonacci level, the 1.371 mark. If the U.S. dollar price dips below 1.371 against the Canadian dollar, the bearish momentum from June 11 from 1.379 will likely test the 38.2% Fibonacci at 1.368.
Furthermore, if the selling pressure exceeds 1.368, the 23.6% Fibonacci will be the next resistance area.
USD/CAD Key Support and Resistance Levels
Traders and investors should closely monitor the key levels below to make informed decisions and adjust their strategies accordingly as market conditions shift.
- Support: 1.371 / 1.368 / 1.365
- Resistance: 1.357 / 1.379 / 1.384

J.J Edwards is a finance expert with 15+ years in forex, hedge funds, trading systems, and market analysis.