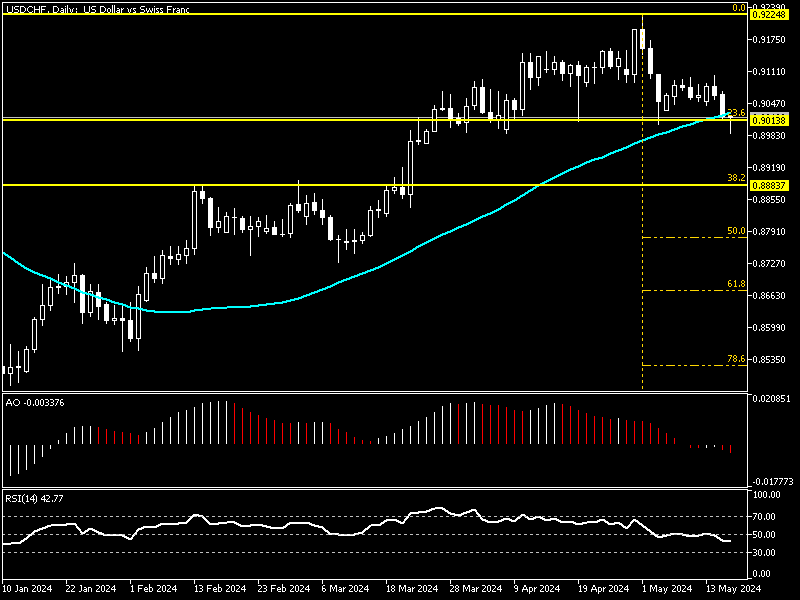
FxNews—The U.S. dollar trades at about 0.901 against the Swiss Franc, clinging to the 23.6% Fibonacci retracement level in today’s trading session.
USD/CHF Technical Analysis – Daily Chart

As of the time of writing, the pair has flipped below EMA 50 in the Daily Chart. The bears are trying to stabilize the price below the exponential moving average. Concurrently, the technical indicators promise a downtrend with the awesome oscillator bars red and below the signal line. The relative strength index aligns with AO, flipped below the median line with a value of 42.7.
The daily chart analysis demonstrates a bear market, but to have a comprehensive outlook of the USD/CHF price movement, we zoom into the 4-hour Chart.
USD/CHF Technical Analysis – 4-Hour Chart

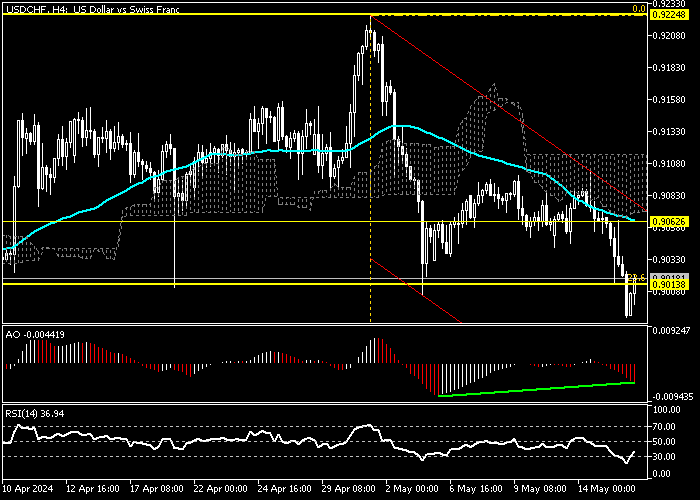
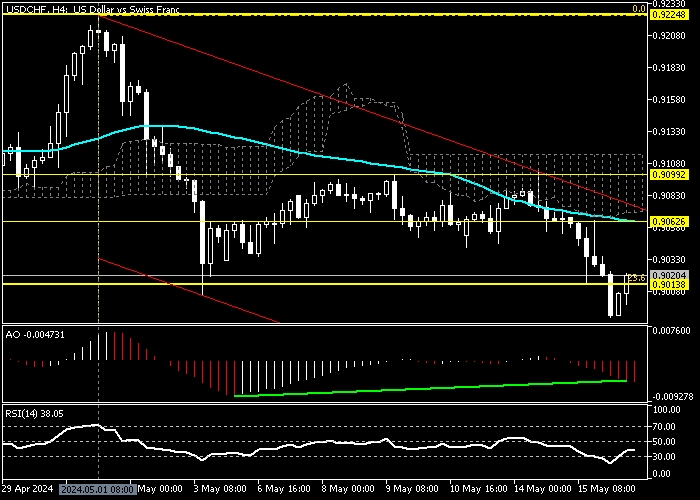
The currency pair in discussion trades in the descending flag, as shown in the image above. The awesome oscillator bars are red and below the zero line but show divergence. Interestingly, the RSI just stepped outside of the oversold area, and at the moment, it shows a value of 37.
These developments in the 4-hour Chart suggest the U.S. dollar is oversold against the Swiss Franc. That said, the U.S. Dollar might erase some of its recent losses by targeting 0.906, a resistance zone reinforced by the descending flag and Ichimoku cloud.
USDCHF Oversold – Wait for Ideal Downtrend Entry

From a technical standpoint, the currency pair is oversold. Despite the bearish momentum, analysts at FxNews suggest waiting patiently for the market to offer a proper price for joining the downtrend.
The RSI and awesome oscillator divergence signal a consolidation phase might be imminent. This could result in the market rising and aiming for the 0.906 mark, a demand zone that offers a decent entry to go short on USD/CHF with a minimum risk.

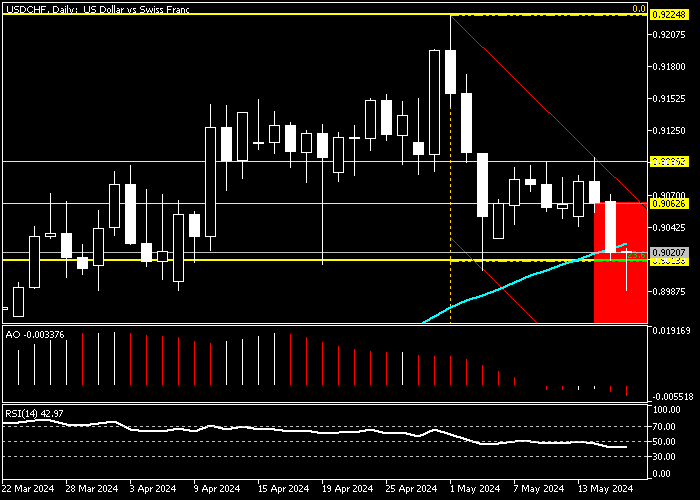
If this scenario occurs, traders and investors should monitor the 0.906 resistance closely for bearish candlestick patterns, such as a doji, long-wick bearish candlestick, or bearish engulfing pattern. Notably, if the USD/CHF price holds below the Ichimoku cloud, the downtrend will likely extend to the 38.2% Fibonacci (0.888), a resistance area reinforced by the lower band of the bearish flag.
USDCHF Bullish Scenario
The 0.909 is critical resistance that also plays a pivotal role in the trend direction. If the USD/CHF bulls cross and stabilize the price above 0.909, the bearish outlook should be invalidated, and the buyers’ path to May’s all-time high (0.9099) will be paved.
USD/CHF Key Support and Resistance
Traders and investors should closely monitor the USD/CHF key levels below to make informed decisions and adjust their strategies accordingly as market conditions shift.
- Resistance: 0.906, 0.909
- Support: 0.888