FxNews—The U.S. Dollar has been in an uptrend against the Swiss Franc since December 28, 2023. However, momentum eased after the currency pair peaked at 0.922, the April 2024 all-time high. Furthermore, the USD/CHF pair traded at about 0.901 in today’s trading session.
USD/CHF Technical Analysis Daily Chart

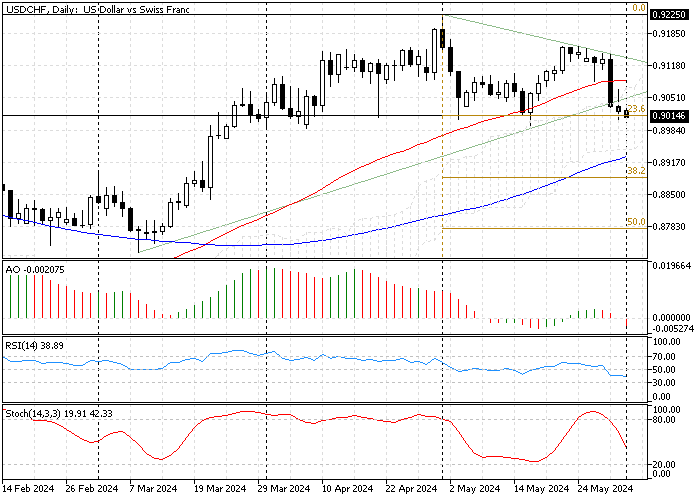
The daily chart above depicts the Fibonacci retracement levels and the respective trendlines and technical indicators. The bears crossed below the descending trendline on Friday. The bearish momentum continued today, with the price trying to dip below the immediate resistance at 0.9014. The 23.6% Fibonacci level backs this level.
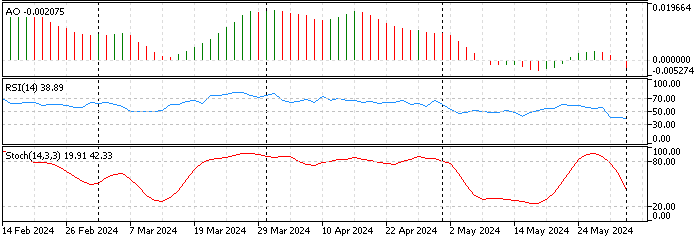
The technical indicators in the USD/CHF daily chart suggest the market is bearish, and the momentum might escalate.

- The awesome oscillator bars are red, creating a longer bar below zero today, showing -0.002 in the description. This decline in the AO’s value means the bearish momentum is strengthening.
- The relative strength index (RSI 14) is below zero, with a value of 38 and decreasing, but it still has room to become oversold. This suggests the downtrend momentum can expand further.
- The stochastic oscillator value is also declining, recording 41 in the %K value, which interprets that the Swiss franc is not overpriced and might erase more of its recent losses against the American currency.
USDCHF Technical Analysis – 3-June-2024

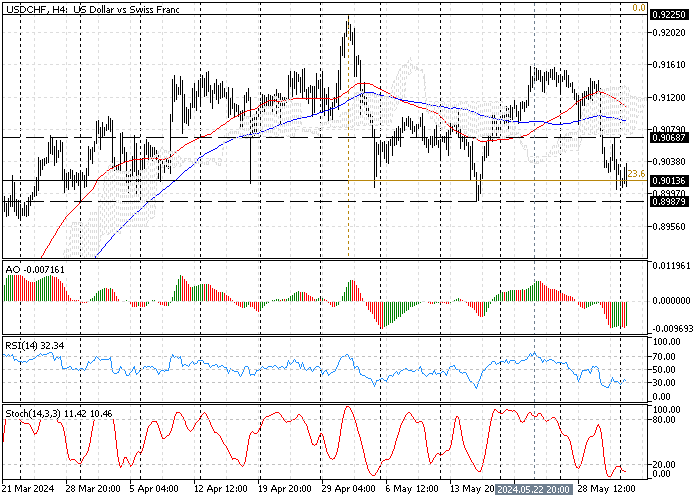
The stochastic oscillator hovers in the oversold territory, recording 10 in the value. This means the USD/CHF is oversold but in the short term. The RSI is also nearing the oversold area, giving the same signal, and the AO oscillator’s recent bar just turned green with a value of -0.007.
These developments in the technical indicators in the USD/CHF 4-hour chart suggest the market might have a pullback from this point.
USD/CHF Forecast – 3-June-2024

- The immediate resistance is slightly below the 23.6% Fibonacci level at $0.898, while the immediate resistance is the May 31 high at $0.906.
Referring to the daily and 4-hour charts, the USD/CHF bullish momentum might pass because the technical indicators signal a strengthening downtrend. Still, once we zoomed in on the 4-hour chart, the technical analysis suggested the Swiss franc is overpriced in the short term.
That said, from a technical perspective, the U.S. Dollar might bounce from the 23.6% Fibonacci support and test $0.906. If this level holds, the downtrend that began on May 22 will likely resume, targeting 38.2 at $0.888. Please note that this support level is backed by SMA 100.
Bullish Scenario
Traders must monitor the immediate resistance at $0.906, a level back by the Ichimoku cloud in the 4-hour chart. For the primary bullish trend to resume, the USD/CHF price must close and stabilize above the $0.906 mark.
If this scenario comes into play, the key support level backing up the trend should be $0.898.
USD/CHF Key Levels – 3-May-2024
Traders and investors should closely monitor the key levels below to make informed decisions and adjust their strategies accordingly as market conditions shift.
- Support: $0.898 / $0.888
- Resistance: $0.906 / $0.916 /$0.922
Disclaimer: This technical analysis is for informational purposes only. Past performance is not necessarily indicative of future results. Foreign exchange trading carries significant risks and may not be suitable for all investors. Always conduct your research before making any investment decisions.