The American currency (USD) trades at about 6.86 against the Danish Krone today.
USD/DKK Daily Chart Fibonacci and Oscillators Insight
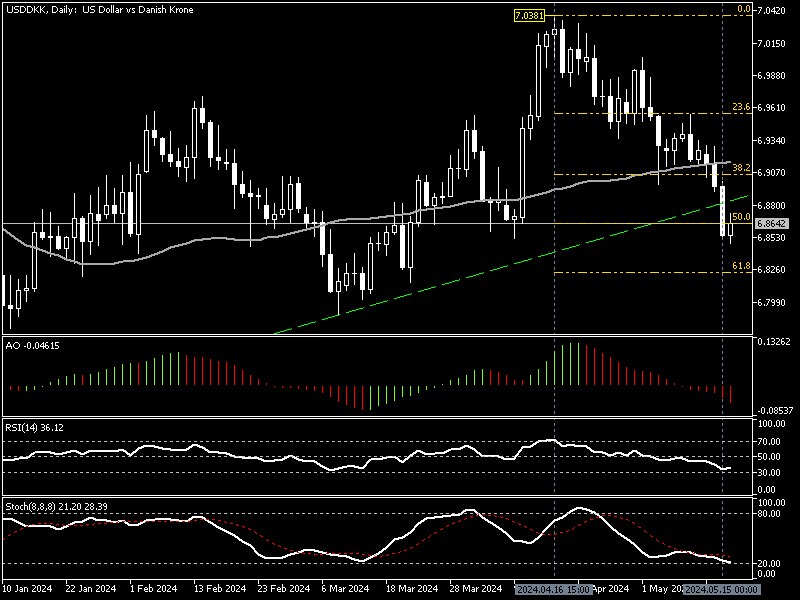
The currency pair has been declining since April 16 from the $7.03 peak. Yesterday (May 15), the bears broke the ascending trendline (in green), and as of this writing, the USD/DKK price stabilizes below the broken trendline, around the 50% Fibonacci retracement level.
The technical indicators in the Daily chart are bearish. The awesome oscillator value is -0.046 with red bars below the signal line, and the RSI value is 36.18 below the median line. On the other hand, the stochastic oscillator value is 28.0, lingering near the oversold zone, but it hasn’t crossed below 20 yet.
These developments in the technical indicators in the daily chart suggest that the USD/DKK is in a bear market, but there might be a pullback because Stocahstic clings to the 20 level.
USD/DKK 4-Hour Analysis – Oversold Conditions
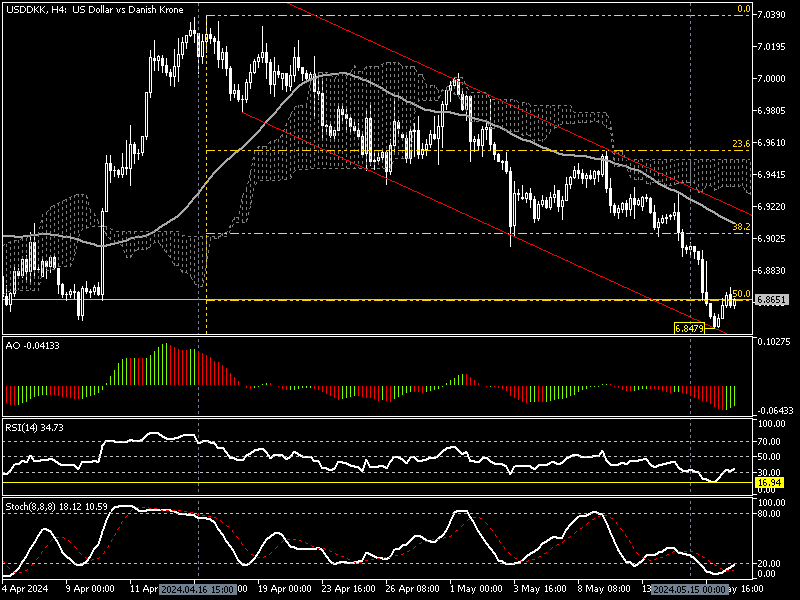
We zoom into the USD/DKK 4-hour chart to conduct a detailed analysis and find key levels and trading opportunities. This graph shows the currency pair’s ranges in the bearish flag, and the market became oversold after the price dipped to as low as $6.84 today.
The RSI indicator was in oversold territory, dipping to as low as 16.9 and just stepping outside the 30 level as the dollar erased some of its losses against the Danish Krone. The Stochastic oscillator aligns with the RSI, floating below 20 and showing 10.5 in its description. Interestingly, the awesome oscillator bars turned green, demonstrating that short-term bullish momentum might be on the horizon.
These developments in the technical indicators in the 4-hour chart suggest that despite the primary bearish trend, the USD/DKK price might stroll into a consolidation phase to erase some of its recent flops.
USDDKK Forecast – Avoid Selling in Oversold Market
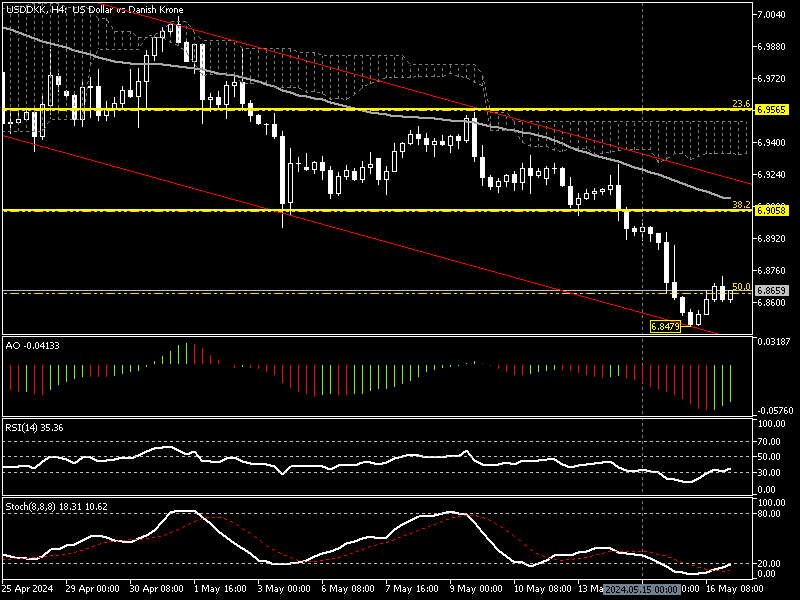
According to the Daily and 4-hour charts, the USD/DKK is in a bear market. That said, the technical tools in the lower time frame suggest a pullback could be imminent. Therefore, analysts at FxNews do not recommend going short in an oversold market.
We advise waiting patiently for the U.S. Dollar to complete the consolidation phase. If this scenario comes into play, the USD/DKK price will likely rise to the 38.2% Fibonacci, the 6.90 mark. This level is backed by EMA 50, Ichimoku cloud, and the upper line of the bearish flag.
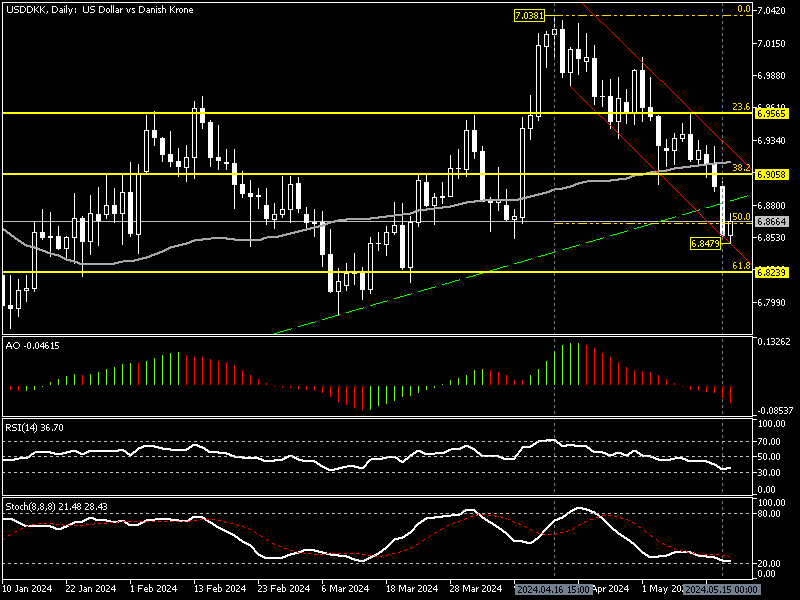
The 6.90 resistance offers a decent demand price for traders and investors to join the bear market. Therefore, traders should monitor this robust resistance area for bearish candlestick patterns such as doji, bearish engulfing, or long-wick candlesticks. If the price holds below the Ichimoku cloud, the downtrend began from $7.03 and could target 6.82, followed by 78.6% Fibonacci, the $6.76 mark.
USD/DKK Bullish Scenario
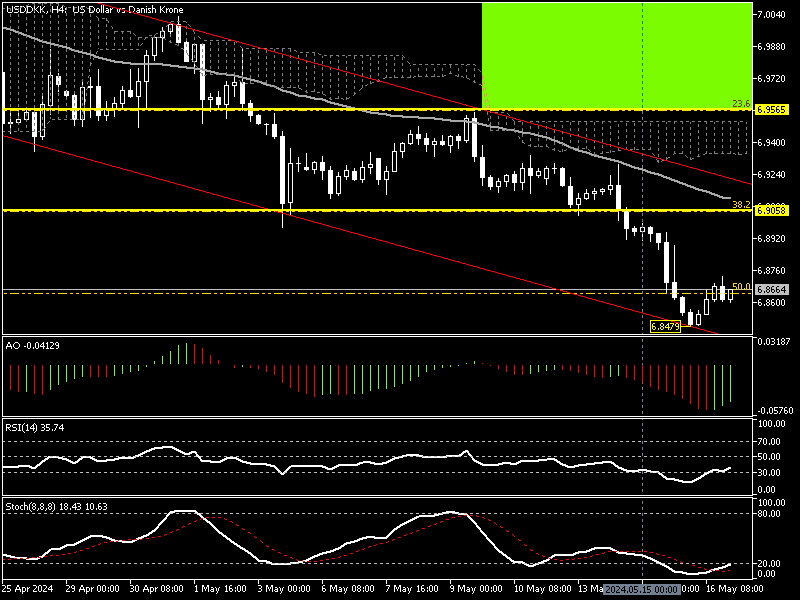
EMA 50 and the Ichimoku cloud divide the bear market from the bull market. The market will likely shift to bullish if the U.S. Dollar gains enough bullish momentum to close and stabilize above the $6.95 resistance. In this scenario, the 6.87 should be considered a new low, and the price could retest the $7.03 resistance, which is the 2024 all-time high.
USD/DKK Key Support And Resistance Levels
Traders and investors should closely monitor the USD/DKKkey levels below to make informed decisions and adjust their strategies accordingly as market conditions shift.
- Support: $6.84, $6.82, $6.76
- Resistance: $6.90, $6.95, $7.03