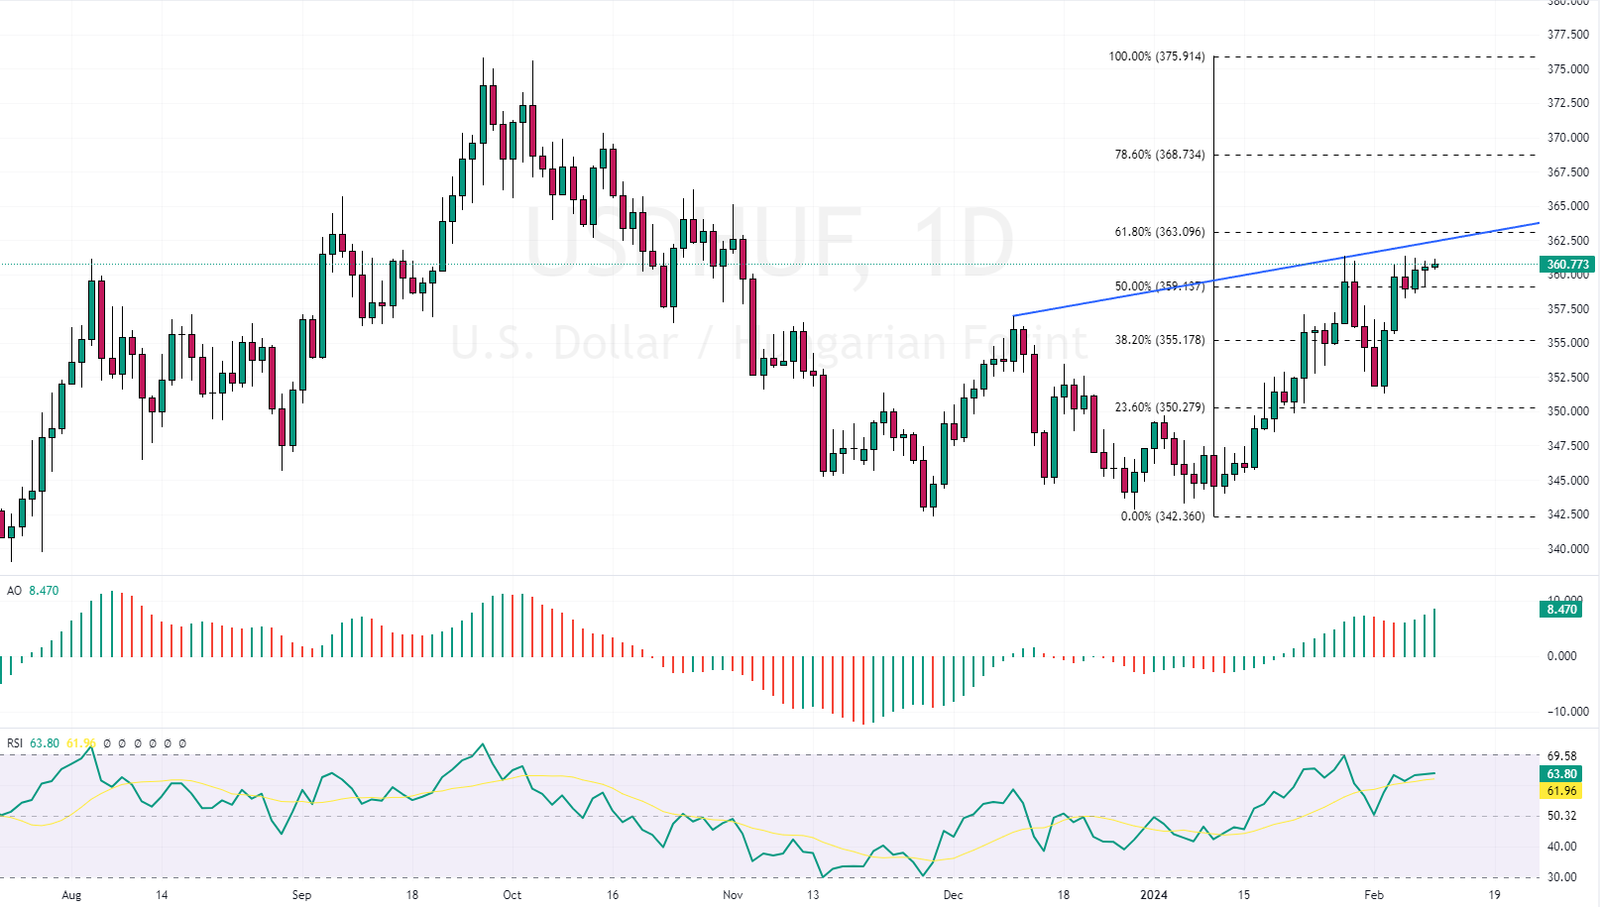
FxNews—The USDHUF (U.S. Dollar vs. Hungarian Forint) price is 360.8 when writing. The pair trades bullishly and is currently located above the 50% level of the Fibonacci support, 359.1.
USDHUF Technical Analysis and Forecast
The technical indicators support the bullish trend. The RSI indicator hovers above the 50 level, and the awesome oscillator bars are green. However, we should zoom into the 4-hour chart to better understand the USDHUF price action.

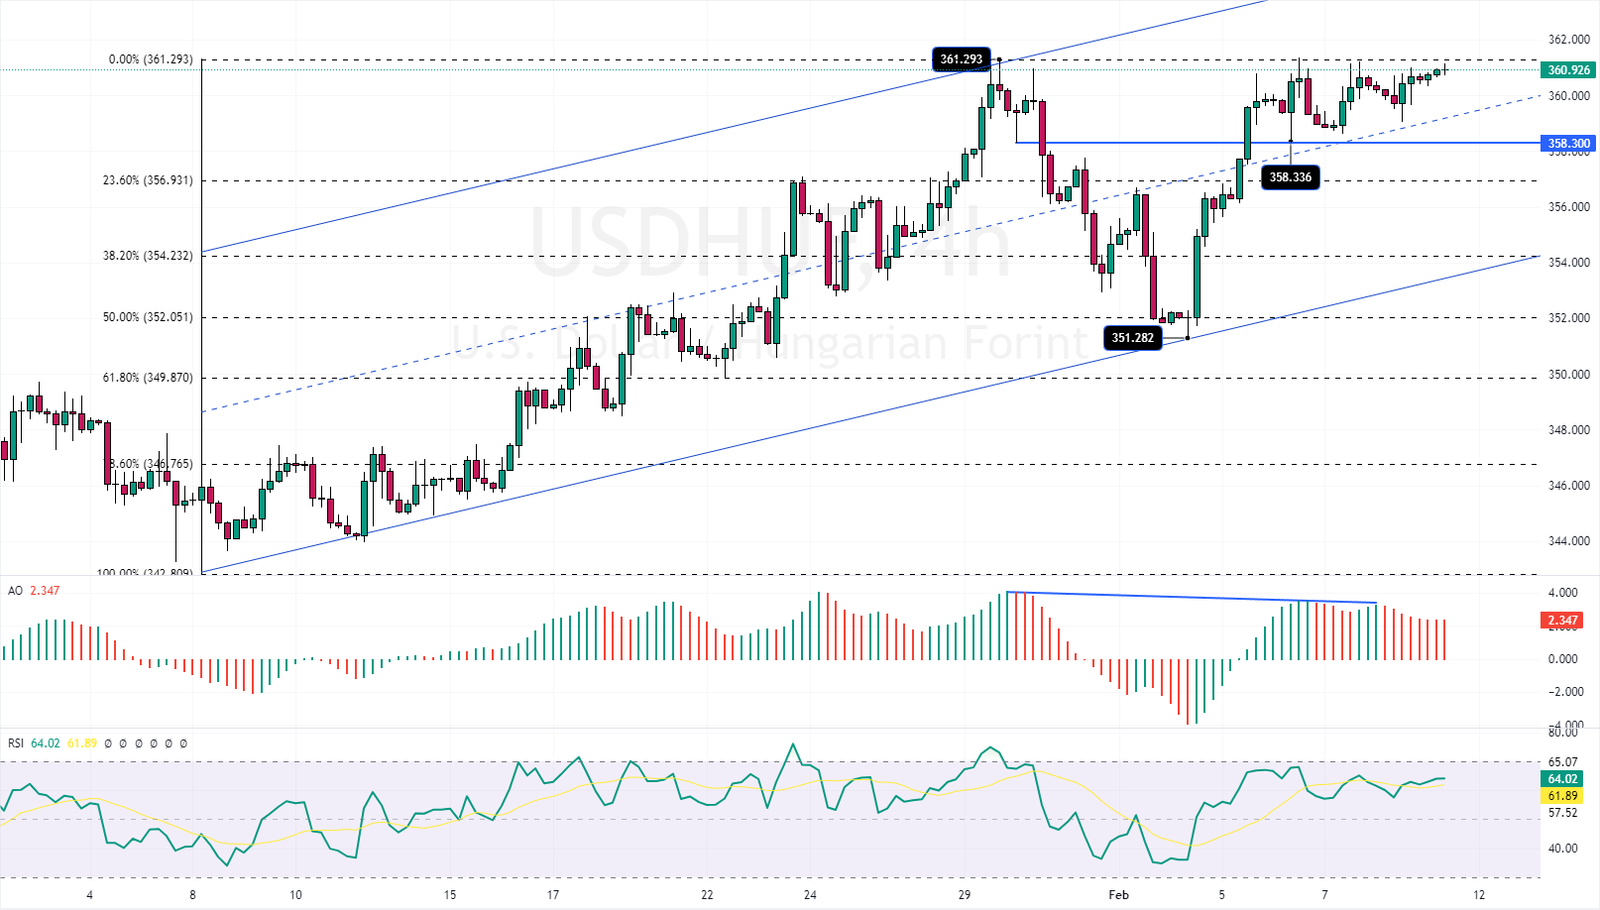
The USDHUF 4-Hour Chart Analysis
The trend seems bullish in the 4-hour chart as the USDHUF price floats inside the bullish flag. However, the pair has been moving sideways since Monday, February 24. The awesome oscillator divergence signal previously warned of the sideways price movement.
From a technical standpoint, the primary USD/HUF trend is bullish, and the RSI indicator supports this idea by hovering above its middle line. Therefore, we can anticipate the U.S. Dollar gaining more in value and aiming for the 78.6% Fibonacci resistance shown in the daily chart, the 367.7 mark.

On the flip side, 358.3 is minor support. Should the price fall below 358.3, the bullish scenario should be invalidated, and the decline may extend to the lower band of the flag, the 354.2 mark. Notably, this level of support is further backed up by the 38.2% Fibonacci support.
Hungary’s Retail Sales Dip Slightly in December 2023
Bloomberg—In December 2023, Hungary saw a slight decrease in retail sales by 0.2% compared to last year, improving from a 5.4% drop the month before. This continued a trend of declining sales for the thirteenth month in a row, but the decrease was the smallest seen in this period.
There was a positive shift in sales of food, drinks, and tobacco, which grew by 1.3%, recovering from a 0.6% fall in November, and sales of automotive fuel also increased significantly by 3.8% after a sharp 25.2% fall. Meanwhile, sales of non-food items went down by 3%, less sharply than the 3.9% decrease seen previously.
Month-over-month, retail trade experienced a growth of 1.4% in December, building on a 1% increase in November. Over 2023, retail sales went down by 7.9%, following a growth of 5.1% in the previous year.