...

USDJPY Market Analysis – Trade the Dips Using Ichimoku

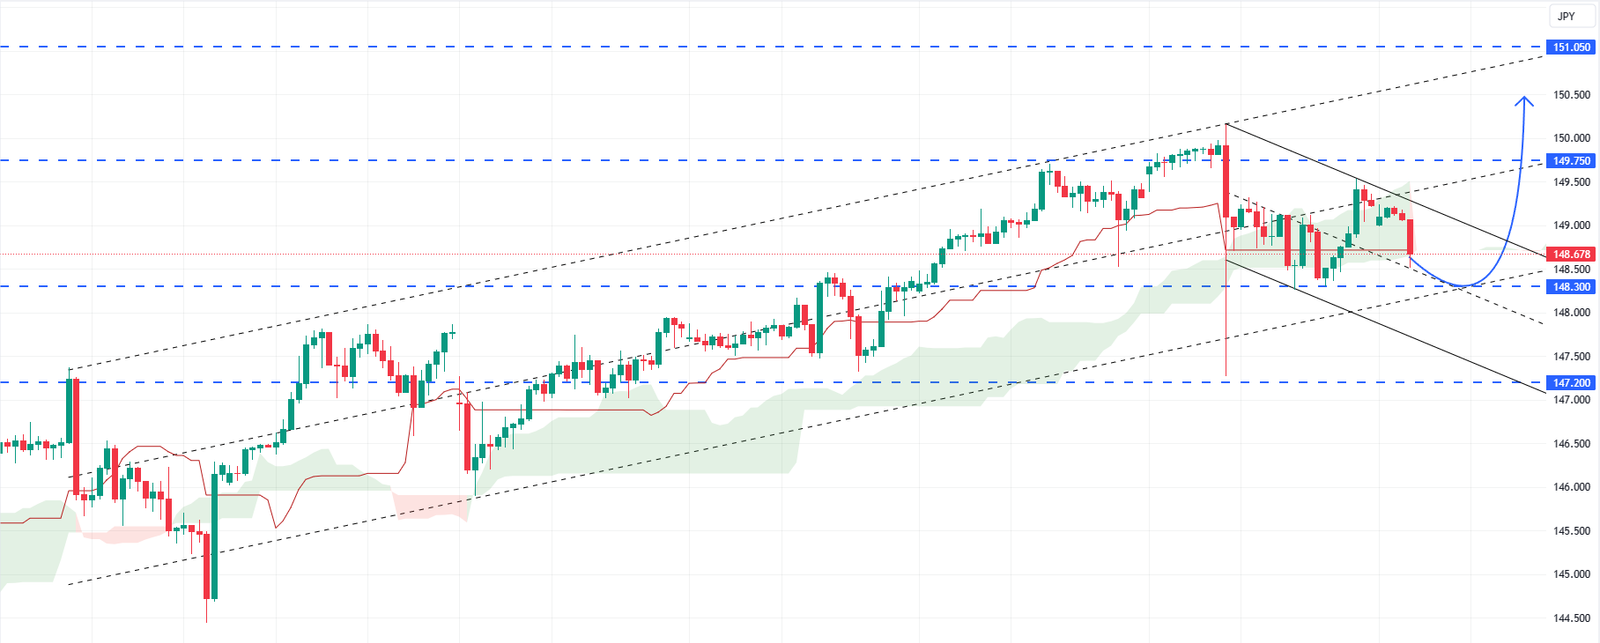
FxNews—The USDJPY currency pair, representing the US Dollar against the Japanese Yen, shows some interesting movements in today’s trading session. It’s bouncing back from the top edge of a downward trend channel. This happens within a pattern known as the Ichimoku Cloud, which usually indicates a period of sideways movement or a “flat” market.
USDJPY Market Analysis - Trade the Dips Using Ichimoku
USDJPY Market Analysis – Trade the Dips Using Ichimoku

USDJPY Market Analysis – Trade the Dips Using Ichimoku

Our technical analysis suggests that we might see the price touch the bottom edge of this Cloud around 148.30 before it starts to climb again, potentially reaching as high as 151.05. A promising sign that this upward movement is happening would be if the price bounces off the bottom edge of an upward trend channel.

However, this prediction could be proven wrong if the price breaks through the bottom edge of the Cloud and settles below 148.3. If that happens, it could mean the price will continue to drop, possibly down to 147.20.

On the other hand, if the price breaks through the top edge of a downward trend channel and settles above 149.75, it would confirm that an upward trend is indeed underway. So, in this USDJPY market analysis, several key levels exist to watch for signs of where the USDJPY might be headed.

Latest Posts

Gold Exceeded $2665: Now Overbought!

Gold exceeded $2665 resistance. However, robust buying pressure made...

USDMXN Breaks Above 20.53: Key Levels and Analysis

USDMXN breaks above 20.53 resistance in continuation of its...

EURJPY Bounced From 162.4: A Bullish Signal

EURJPY bounced from 162.4 support, resuming its bullish trajectory....

Bullish Symmetrical Triangle Signals NATGAS Breakout

NATGAS trades sideways in a low-momentum market inside the...

Crude Oil Holds at $72.8 After Initial Price Dip

Crude Oil price dipped from $75.24, testing the %50.0...

Gold Exceeded $2665: Now Overbought!

Gold exceeded $2665 resistance. However, robust buying pressure made...

Bullish Symmetrical Triangle Signals NATGAS Breakout

NATGAS trades sideways in a low-momentum market inside the...

Crude Oil Holds at $72.8 After Initial Price Dip

Crude Oil price dipped from $75.24, testing the %50.0...

Gold Stays Below $2665 Ahead of US Economic Data

On Monday, the price of gold remained below $2,665...

US Gasoline Futures Hit $2.07 Amid Oil Surge Amid Oil Surge

Gasoline futures in the US have climbed past $2.03...

NATGAS Dips 14% Amid Low Storage Draws

Natural gas prices in the U.S. fell sharply by...

WTI Crude Slips From $74 as Dollar Strengthens

Crude oil prices for West Texas Intermediate (WTI) dipped...

NATGAS is Hit $4 As the Year Ends

NATGAS hit $4.0, trading in a robust uptrend. The...