FxNews—In our XAUUSD market analysis, we’re looking at the relationship between Gold (XAU) and the US Dollar (USD), which is often referred to as “Gold vs. US Dollar.”

Gold Dips Below Ichimoku Cloud Suggesting Sell Opportunity
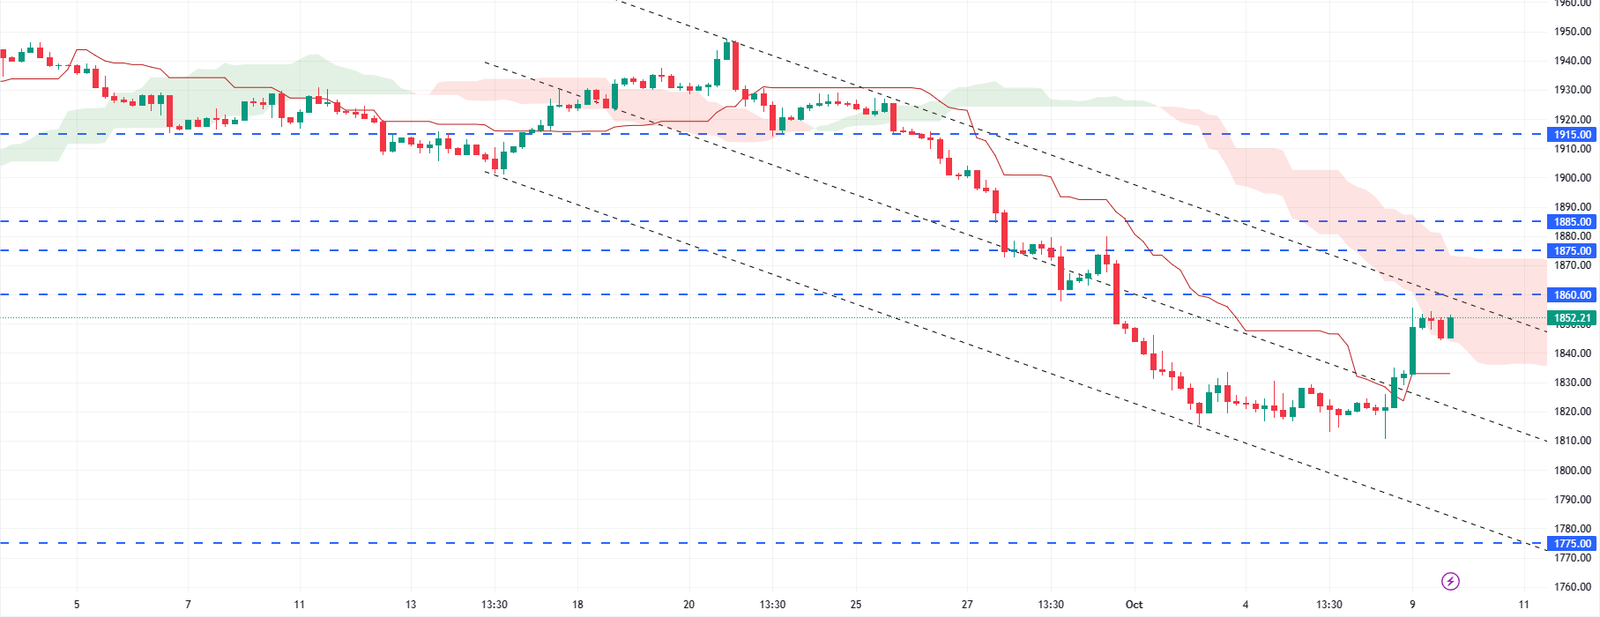
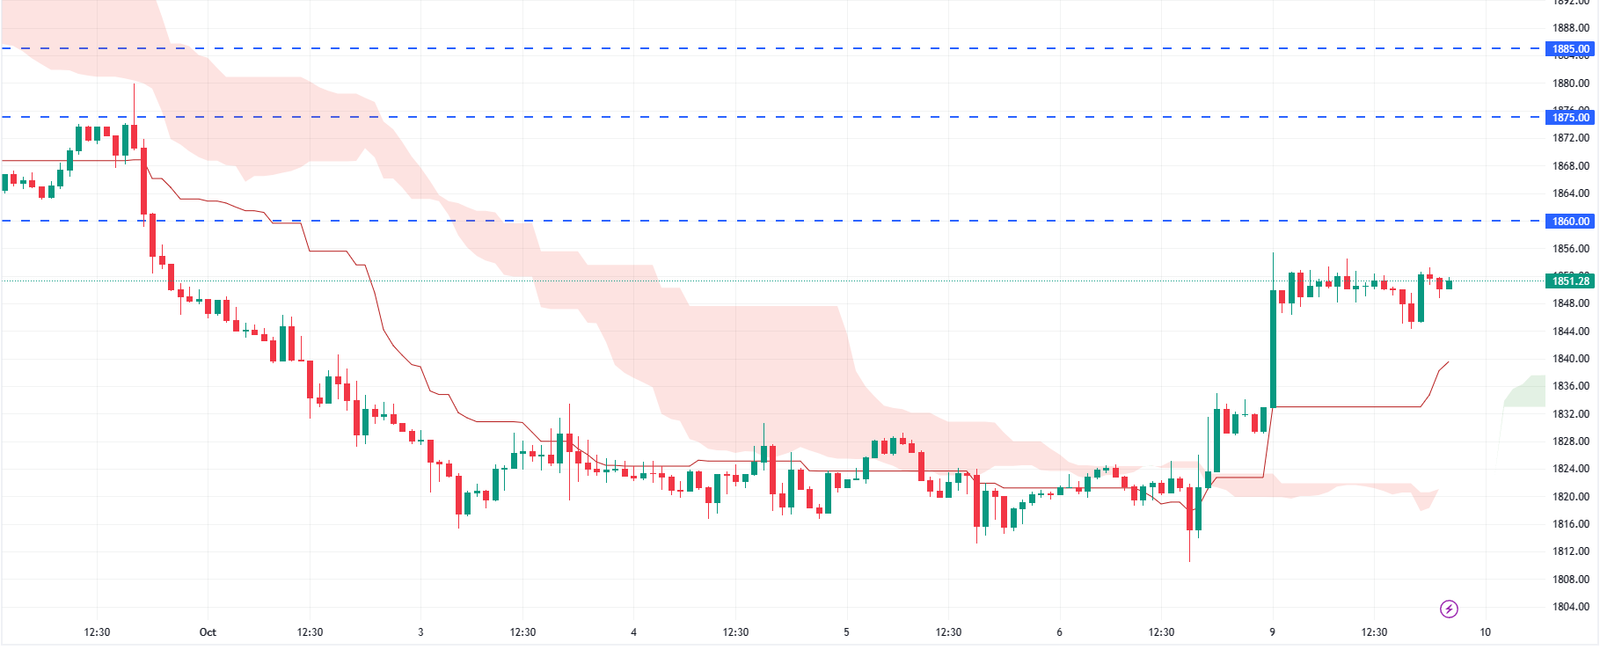
Gold is undergoing a correction phase after bouncing back from a support level. This means that the price of Gold has been increasing and has started to decrease. The instrument moves below the Ichimoku Cloud, a technical analysis tool to identify trend direction, potential support and resistance levels, and generate buy-sell signals. W
hen the price is below the Cloud, it suggests a bearish trend, indicating that it might be a good time to sell.
Gold Price May Reach $1860 Before Dropping to $1775
We anticipate testing the upper boundary of the Cloud at $1,860. This means the price may rise to this level before falling again, potentially down to $1,775. A rebound from the upper boundary of the bearish channel, a pattern on a chart that shows the price dropping over time, will confirm this downward trend.

However, this scenario could be canceled if the price breaks above 1885 and breaks the upper boundary of the Cloud. A breakout occurs when the price moves outside a defined boundary, in this case, the upper boundary of the Cloud. If this happens, it could mean further growth to 1915.
On the other hand, if the lower boundary of the corrective channel breaks out with the price securing under 1875, it would confirm our prediction of a decline. The corrective channel temporarily reverses an overall upward or downward trend.