FxNews—In today’s comprehensive USDMXN forecast (US dollar and Mexican Peso), we will scrutinize Mexico’s current economic conditions and meticulously delve into the details of the USDMXN pair’s technical analysis.
A Closer Look at Mexico’s Inflation Rate
Bloomberg—In October 2023, Mexico’s yearly inflation rate slightly decreased, dropping 4.38% from 4.45% in the preceding month. This was marginally lower than the market forecast of 4.28%. This represents the ninth straight month of diminishing inflation, bringing the rate to its lowest since February 2021.
A variety of sectors saw a slowdown in inflation. These include food & non-alcoholic beverages (down to 4.89% from 5.90% in September), alcoholic beverages (5.85% from 6.14%), clothing & footwear (4.01% from 4.50%), and furnishings, household equipment & routine household maintenance (3.63% from 3.96%). Additionally, transportation (3.71% from 3.93%), recreation & culture (2.72% from 2.87%), restaurants & hotels (7.83% from 8.55%), and miscellaneous goods & services (7.54% from 7.95%) also experienced a decrease in inflation.
However, the housing & utilities sector saw a rebound in prices (1.01% from -0.30%), primarily due to a 2.57% increase in energy prices and tariffs following the conclusion of the subsidy that supported the summer electricity tariff program in 18 cities. Monthly, the Consumer Price Index (CPI) saw a rise of 0.38% in October, following a 0.44% increase in September.
Economic Implications
A decrease in inflation is generally seen as a positive sign for the economy. It indicates stability and suggests rising prices are not eroding consumers’ purchasing power. However, monitoring these trends closely is important, as prolonged low inflation can signal a sluggish economy. In this case, the easing inflation coupled with the rebound in housing and utility prices suggests a balanced economic scenario.
USDMXN Forecast – A Potential Trend Reversal
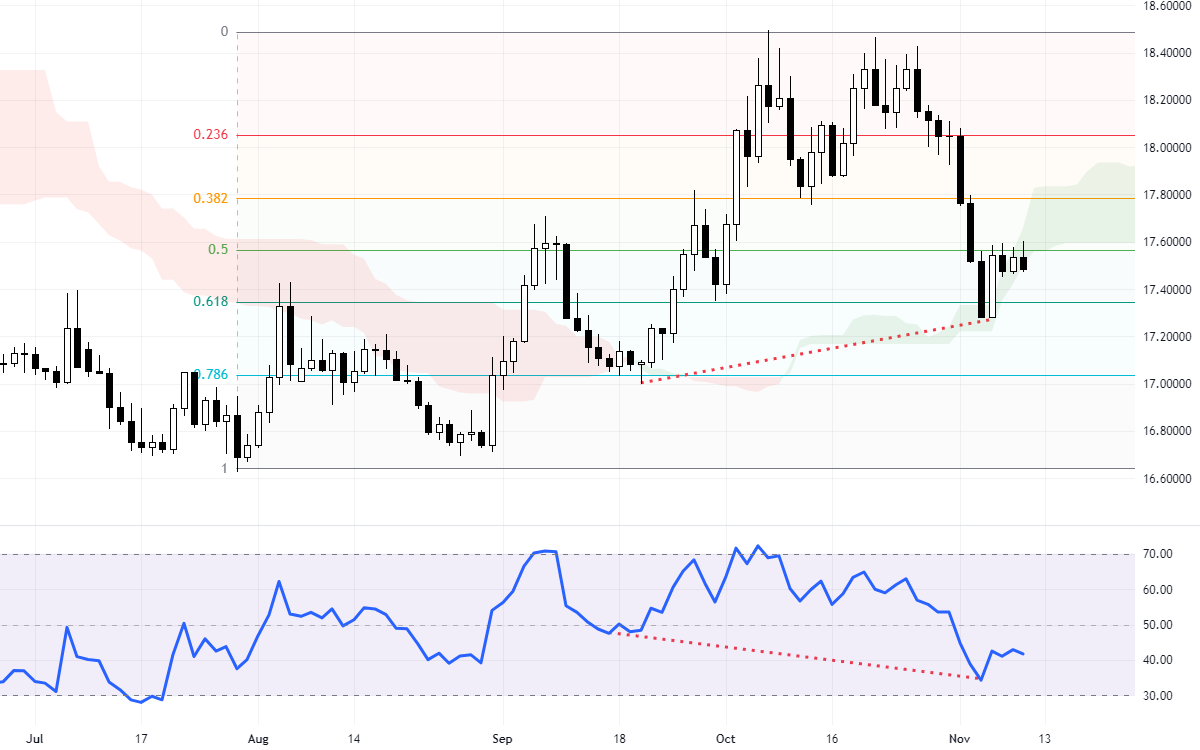
The USDMXN downtrend appears to be easing at the 61.8% Fibonacci retracement level. This level coincides with the Ichimoku cloud, making this resistance level particularly robust. Moreover, the Relative Strength Index (RSI) indicator shows divergence, which could signal a range market or trend reversal.

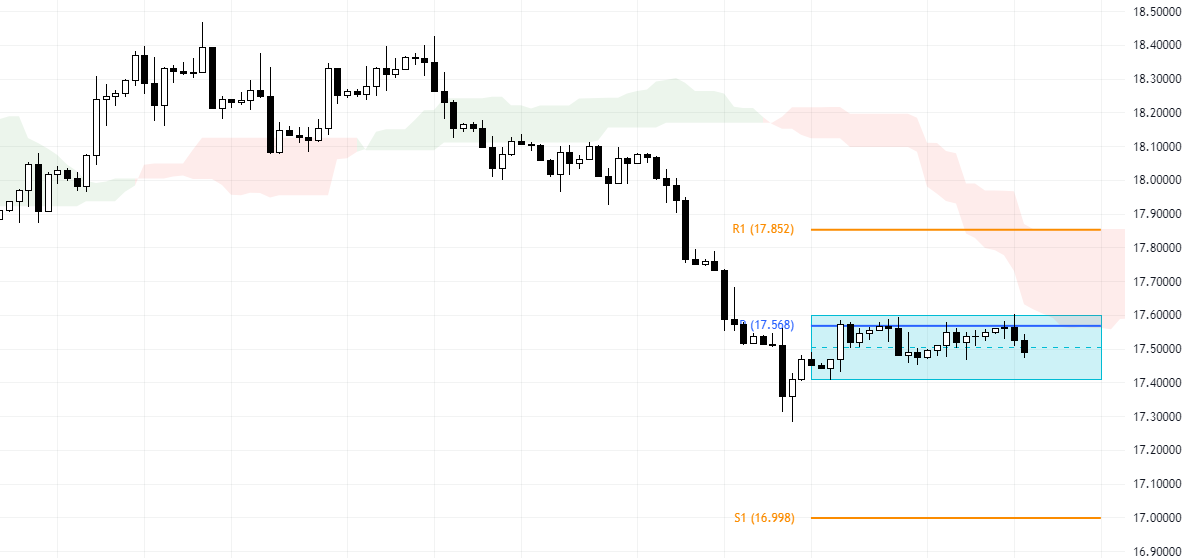
To gain a more in-depth understanding and identify potential triggers, we’ve zoomed into the USDMXN 4-hour chart. Currently, the pair is trading within a narrow range, as the blue box on the 4-hour chart depicts. The pivot point is acting as resistance. If the price holds below this level, we anticipate another fall, targeting S1 (16.998).

Conversely, if the USDMXN price stabilizes above the pivot, we could see upward momentum towards R1 (17.8 resistance).
Our analysts at FxNews recommend closely monitoring these levels and looking for candlestick patterns to make informed decisions with minimal risk. Stay updated with our forex forecasts for the latest market insights.