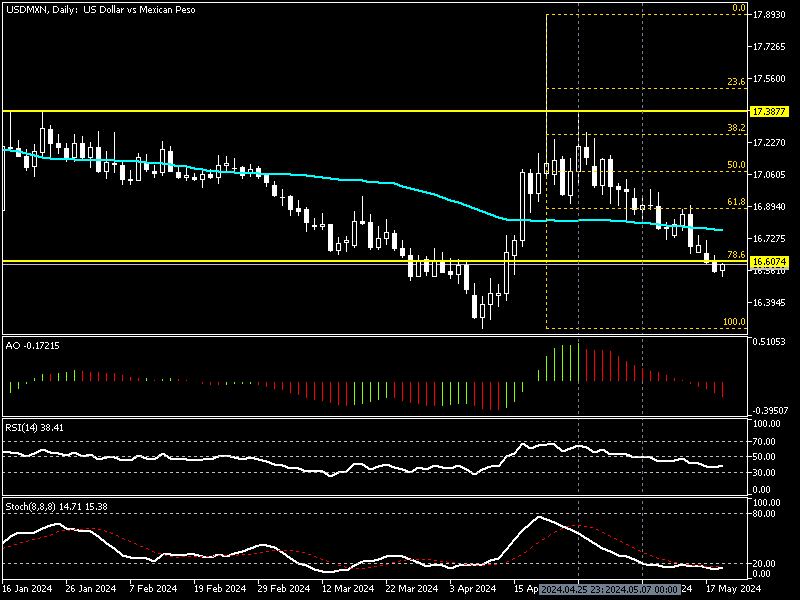
FxNews—The U.S. Dollar price dip against the Mexican Peso extended below the 78.6% Fibonacci at about $16.6 this week. As of writing, the USD/MXN is having a pullback to test the broken resistance, which is now acting as support.
USD/MXN Technical Analysis Daily Chart

The currency pair in discussion has been experiencing extreme selling pressure since April 25 from the $17.38 mark. This price development drove the stochastic momentum into the oversold area. The indicator has been stuck below 20 since May 7, and as of writing, the %K line value is still in the oversold zone, displaying 14 in its value.
The awesome oscillator bars are red and below the signal line, recording -0.17 in their histogram. Concurrently, the RSI value is 38.0, hovering below the middle line, signaling that the market is not oversold yet.
These developments in the technical indicators are interpretable as the bear market prevailing. We zoom into the USD/MXN 4-hour chart to conduct a detailed analysis and find key levels and trading opportunities.
USD/MXN Technical Analysis 4-Hour Chart

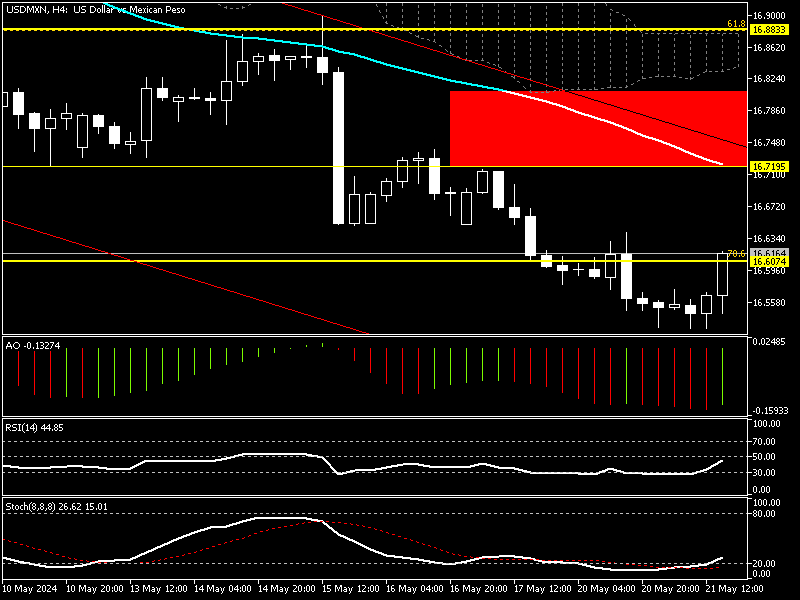
The signals we receive from the 4-hour chart align with the daily chart. The diagram above shows that the USD/MXN pair is below the Ichimoku Cloud and EMA 50 and testing the 78.6% Fibonacci.
The RSI value is 42, pulling back from the oversold area, and the Stochastic Oscillator is stepping out of the oversold territory, recording 24 in the %K line. Interestingly, the awesome oscillator bars changed their color to green, a weak signal for the current uptick momentum.
These developments in the technical indicator tell us that today’s price pullback might extend to EMA 50, followed by the Ichimoku Cloud resistance area.
USDMXN Forecast – Bearish Trend and Potential Pullback

The primary trend is bearish, but the Stochastic Oscillator and RSI signal a pullback or a consolidation phase could be imminent. That said, analysts at FxNews suggest waiting for the USD/MXN price to complete the correction cycle. If the price reaches the descending trendline at about $16.7, followed by the Ichimoku Cloud, this level offers a decent entry point to join the downtrend.
Therefore, traders and investors should monitor these key resistance areas for bearish candlestick patterns. If this scenario occurs and the price declines from the key resistance, the next bearish target could be $16.47, followed by the $16.38 mark.
USD/MXN Bullish Scenario

The 61.8% Fibonacci at $16.88 plays the pivot between the bear market and the bull market. If the exchange rate surpasses the pivot, today’s pullback will likely expand, and the bulls’ next target could be the 50% Fibonacci at about $17.07.
USD/MXN Key Support and Resistance
Traders and investors should closely monitor the USD/MXN key levels below to make informed decisions and adjust their strategies accordingly as market conditions shift.
- Support: $16.47, $16.38, $16.26
- Resistance: $16.7, $16.88, $17.07