FxNews—The U.S. Dollar trades inside the bullish channel at about 10.8 against the Norwegian Krone, slightly above EMA 50, which supports the uptrend. EMA 50 neighbors the lower line of the flag, a critical level that kept the USDNOK price from further decline.

Interestingly, the daily chart formed a long wick bullish candlestick pattern on Friday, which suggests that the trend may reverse from the 1.80 mark.
We should zoom in on the 4-hour chart for a comprehensive technical analysis. The lower time frame will assist us in uncovering key technical levels and trade opportunities and marking proper exit points.
Awesome Oscillator Divergence Hints at Trend Reversal

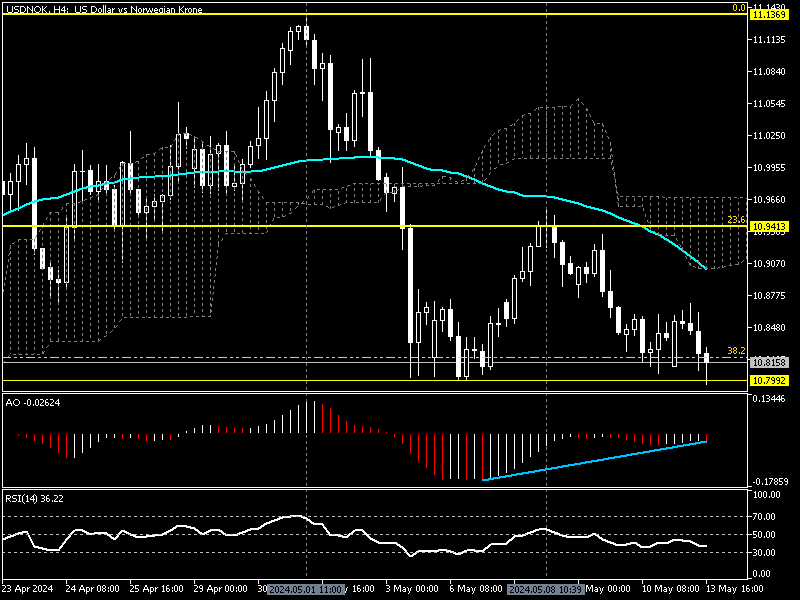
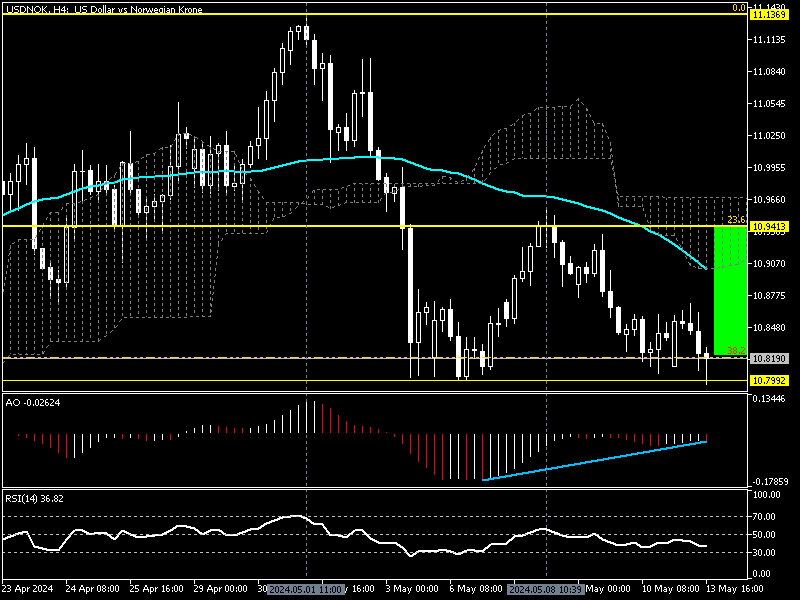
As of writing, the pair trades above the 10.79 key support in conjunction with the %38.2 Fibonacci retracement level. The relative strength index hovers below the median line at about 36.2, hinting at a bearish market.
On the other hand, the Awesome oscillator demonstrates massive divergence in its histogram, interpreting that the trend will likely reverse or step into a consolidation phase. This enormous divergence in the AO histogram robustly supports the expectation that the trend can turn bullish, at least for a short while.
USDNOK Forecast – Bulls Eye 10.94 as Fibo Holds

From a technical perspective, the USDNOK uptrend can resume if the bulls maintain the price above %38.2 Fibonacci support. In this scenario, the U.S. Dollar will likely erase some of its recent losses against the Norwegian Krone by retaking the May 8 high, the 10.94 mark.
Therefore, traders and investors should monitor the price action and candlestick patterns near the mentioned Fibonacci level.
USDNOK Bearish Scenario

On the flip side, if the Norwegian Krone pushes the Pound Sterling’s price below the 10.79 support, the downtrend initiated on May 1st from 11.13 will likely expand. In this scenario, the next bearish target can be the %50 Fibonacci retracement level, the 10.72 mark.