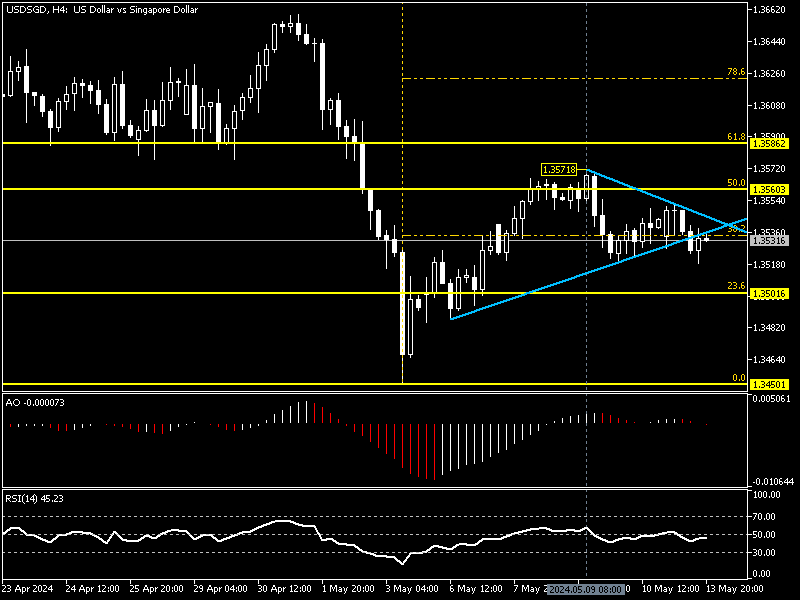
FxNews—On May 9, The American dollar surged as high as 1.357 against the Singapore dollar. However, the bulls failed to sustain the momentum above the 50% Fibonacci retracement level, the 1.3560 mark. Consequently, the USD/SGD price declined; as of writing, it trades around 38.2% Fibonacci at about 1.353.
The daily chart below demonstrates the currency pair in discussion trades in the bullish flag and above EMA 50, indicating we are in a bull market.

USDSGD Technical Analysis – AO and RSI Indicate Sell Signal
The 4-hour graph grants us a closer look at the price action. As shown in the image below, the sellers are trying to stabilize the market below the 38.2% Fibonacci. Concurrently, the market dipped below the trendline in blue, and the technical indicators support the bearish momentum in play.

The relative strength index value is 45, below the median line, and the awesome oscillator bars are red below the signal line. This interpreted that the selling pressure will likely increase.
USDSGD Forecast – Rate Could Drop Below 1.35
From a technical perspective, the USD/SGD price dip will likely expand if the bears maintain the exchange rate below 1.3560. In this scenario, the next target would be 1.350, followed by the May 3rd low, the 1.345 mark.
The Bullish Scenario
The key barrier to the uptrend’s resumption is the 50 Fibonacci. If the USD/SGD price crosses above the 1.3560 mark, the bounce that began on May 3rd will resume, initially targeting the 1.358 mark.