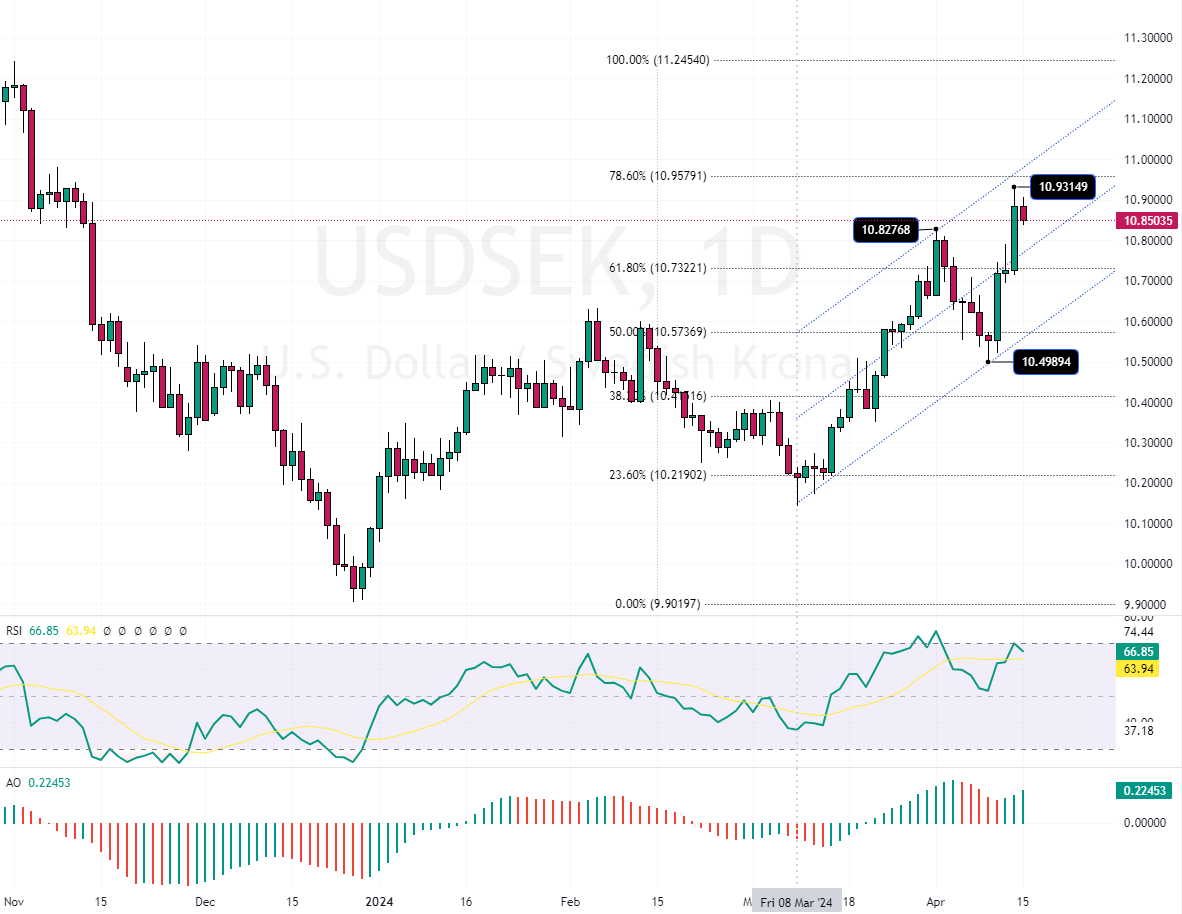
FxNews – The U.S. Dollar has been in an uptrend against the Swedish Krona since March 24. As of this writing, the USDSEK pair trades slightly below the 78.6% Fibonacci support at about 10.85.

As shown in the USDSEK daily chart above, the awesome oscillator diverges its bars, and the RSI indicator hovers around 67, slightly below the overbought level. These two technical indicators suggest there might be a consolidation phase on the horizon, and the price of the USDSEK pair might dip, but the bears have the 10.82 minor barriers to overcome.
To better understand the USDSEK price movement, we zoom into the 4-hour chart to assess more details.
USDSEK Forecast: 4-Hour Chart Analysis

The awesome oscillator’s bars have turned red in the 4-hour chart, while the RSI indicator has exited the overbought zone. This is in line with our technical analysis on the daily chart.
Therefore, from a technical perspective, analysts at fxnews expect the USDSEK price to dip and test the lower band of the bullish flag, which coincides with the 61.8% Fibonacci support around 10.73. The 10.73 level can offer a decent entry point for bullish traders to join the USDSEK bull market.
Conversely, the bull market should be invalidated if the price crosses and stabilizes itself below the 61.8% Fibonacci support level.