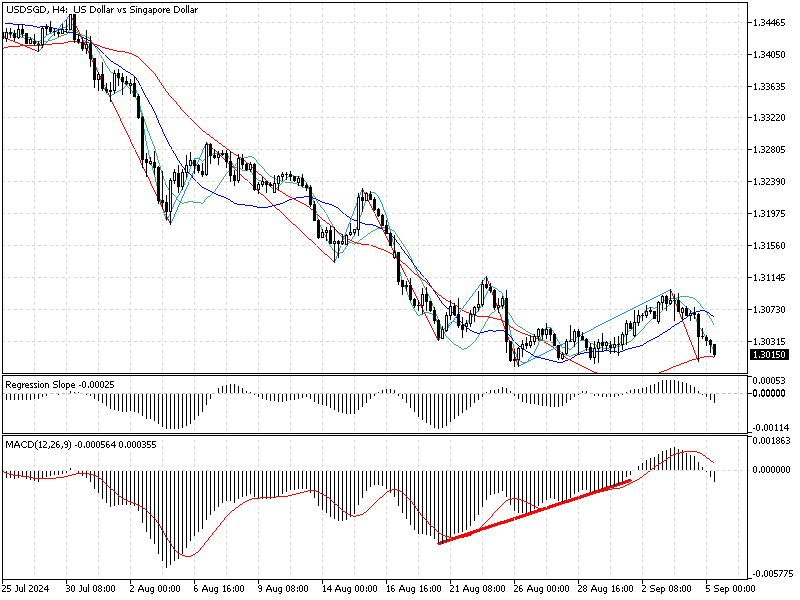
FxNews—The U.S. dollar trades are bearish against the Singapore dollar at about 1.302 in today’s trading session. The USD/SGD currency pair tested the 1.310 resistance on September 3 but failed to surpass it with the 100-period simple moving average.
As a result, the downtrend triggered again, and the bears are currently facing the August 26 low at 1.299. The USD/SGD 4-hour chart below demonstrates the price, key support and resistance levels, and the technical indicators utilized in today’s analysis.

USDSGD Technical Analysis – 5-September-2024
As shown in the image above, the technical indicators suggest the primary trend is bearish, and the market is not oversold, as both the RSI and the Stochastic oscillator hover above the 20 and 30 levels, respectively.

But, the awesome oscillator signals divergence in its histogram, meaning the market could step into a consolidation phase, or the trend could reverse from this point. Therefore, we are monitoring the 1.299 support closely. Interestingly, the MACD indicator signals divergence, too, adding credit to the AO’s signal.
USDSGD Forecast – 5-September-2024
As elaborated earlier in this article, the primary trend is bearish. The critical resistance level is the August 26 low at 1.299. If the bears close and stabilize the price below 1.299, the downtrend will likely be triggered again.
In this scenario, the next bearish barrier will be the 1.20 support. Furthermore, if the selling pressure exceeds 1.20, the next supply zone will be the 1.10 area.
It is worth noting that the bearish scenario should be invalidated if the USD/SGD price crosses and stabilizes above the September 3 high, the 1.310 mark.
- Also read: USD/DKK Forecast – 30-August-2024
USDSGD Bullish Scenario – 5-September-2024

The September 3 high at 1.310 is the primary resistance area. If the bulls (buyers) cross above this ceiling with the 100-period SMA, the August 5 low at 1.318 could be set as the next bullish target.
Furthermore, if the buying pressure exceeds 1.310, the next resistance area will be the August 7 high, at approximately 1.328.
Please note that if the USD/SGD price crosses above it, the 50-period simple moving average will provide immediate support for the bullish scenario.
USDSGD Support and Resistance Levels – 5-Sepmberte-2024
Traders and investors should closely monitor the key levels below to make informed decisions and adjust their strategies accordingly as market conditions shift.
- Support: 1.299 / 1.20 / 1.10
- Resistance: 1.310 / 1.318 / 1.328
Disclaimer: This technical analysis is for informational purposes only. Past performance is not necessarily indicative of future results. Foreign exchange trading carries significant risks and may not be suitable for all investors. Always conduct your research before making any investment decisions.