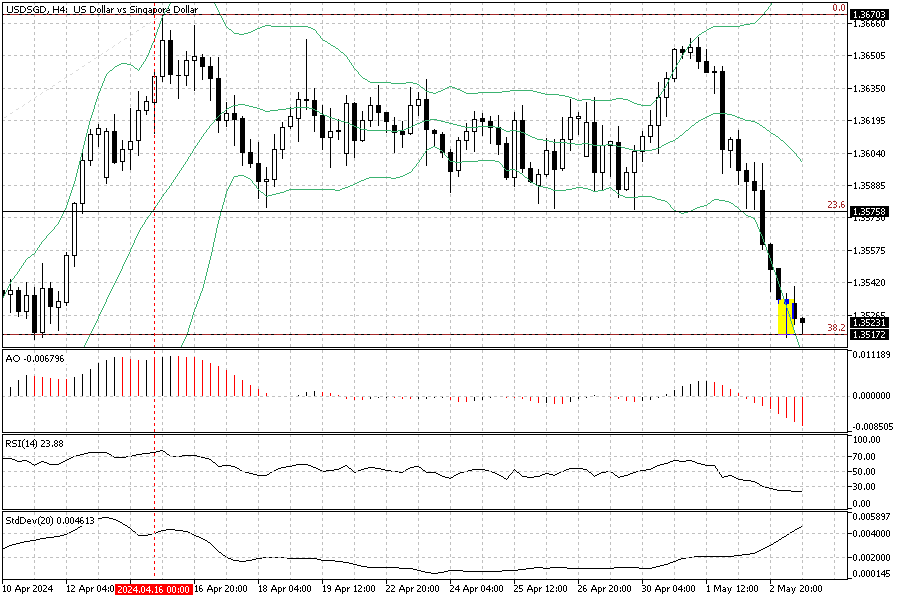
FxNews—The U.S. Dollar has been losing value against the Singapore dollar since the pair peaked at the 1.317 high on April 16th. Selling pressure broke down the ascending trendline in red shown in the USDSGD daily chart, and consequently, the downward momentum resumed in today’s trading session.
Bearish Signals in Daily Chart

As of writing, the USDSGD trades close to the 38.2% Fibonacci level at about 1.351. The technical indicators show bearish signals in the daily chart as well. The awesome oscillator bars are red, and the RSI flipped below the 50 level.
Let’s dissect the market movement in the 4-hour chart to understand better and forecast the USDSGD’s next move and trading potential.
USDSGD Reacts to Fibonacci with Hammer Candlestick

The USDSGD currency pair has reacted positively to the 38.2% Fibonacci support (1.3517), resulting in a bullish hammer candlestick pattern. Looking at the RSI, we notice the indicator floats below 30, which indicates an oversold market. Therefore, the bulls might add pressure, and the market might experience a slight uptick in momentum to correct its sharp loss in the past two days.
USDSGD Forecast – Bearish Trend Below 1.357
From a technical standpoint, the primary trend of the USDSGD pair is bearish as long as the price is below the 1.3575 resistance. The next bearish target will likely be the 1.347 mark, which coincides with the 50 Fibonacci level.
It is noteworthy that the RSI and Bollinger bands signal an oversold market. Therefore, the price might rise to test the 1.3575 resistance before the downtrend resumes. This demand level would provide a decent entry point for joining the bear market, and we recommend waiting for the USDSGD price to go through the correction phase.
Investors should know that entering an oversold or overbought market is not recommended and involves greater risk. We suggest waiting for the consolidation phase to enter the market at a better price.

J.J Edwards is a finance expert with 15+ years in forex, hedge funds, trading systems, and market analysis.


