In today’s trading session, the American currency is in a bear market, trading at about 1.34 against the Singapore dollar.
USD/SGD Technical Analysis Daily Chart

The daily chart above shows the recent candlesticks, which indicate a bear market with lower highs and lower lows. The USD/SGD price is below EMA 50 (depicted in blue), suggesting a downtrend. The awesome oscillator aligns with the primary trend; the bars are red and below the signal line, recording -0.008 in the histogram.
The RSI (14) value is 41, below the median line. But the stochastic oscillator is natural, floating sideways with a %K value 37.
These developments in the USD/SGD daily chart suggest a robust downtrend. However, it is better to zoom into the 4-hour chart for a detailed analysis and to find critical levels and trading opportunities.
USD/SGD Technical Analysis 4-Hour Chart

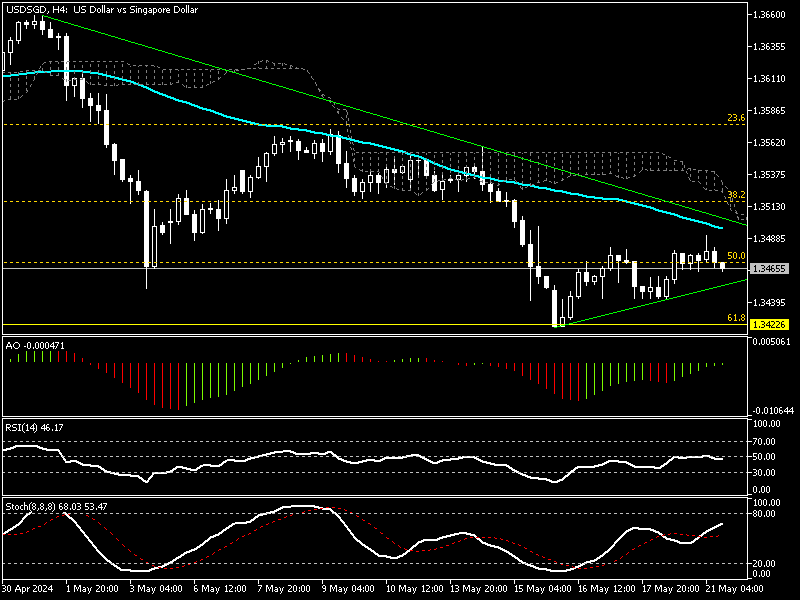
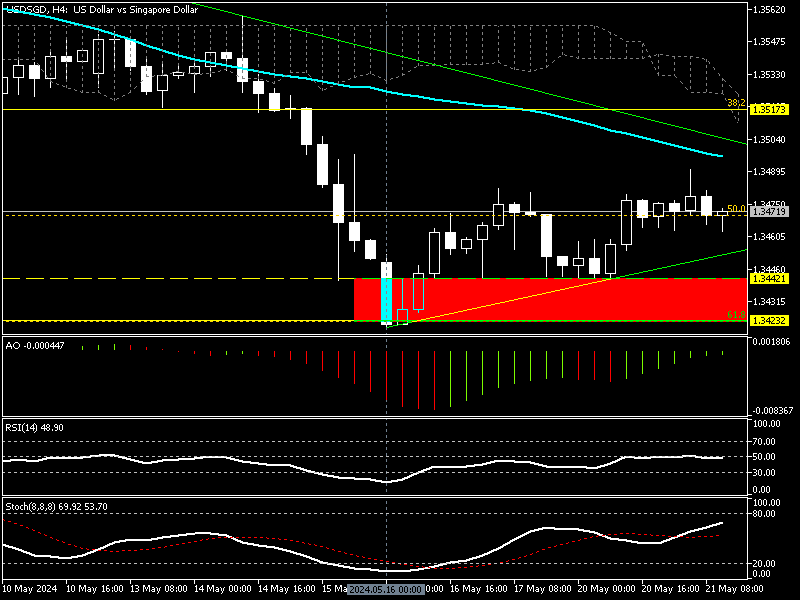
The smaller time frame provides exciting information about the price action. The primary trend is bearish, but the U.S. Dollar pulled back from the 61.8% Fibonacci retracement level at 1.342. Looking at the 4-hour chart, we notice the price ranges inside the symmetrical triangle pattern and approaches the apex. This suggests the market needs a breakout before the next wave starts.
The technical indicators provide mixed signals. The RSI (14) value is 45, floating sideways near the middle line, suggesting a neutral or low momentum market. The awesome oscillator bars are green, approaching the signal line, indicating bullish momentum in the market.
These developments in the technical indicator suggest a neutral market, meaning traders and investors are waiting for a break out that could define the next market direction.
USDSGD Forecast – Break Below 1.34 Signals More Losses

From a technical standpoint, the primary trend is bearish, with the U.S. Dollar ranging sideways against the Singapore dollar, approaching the apex of the symmetrical triangle.
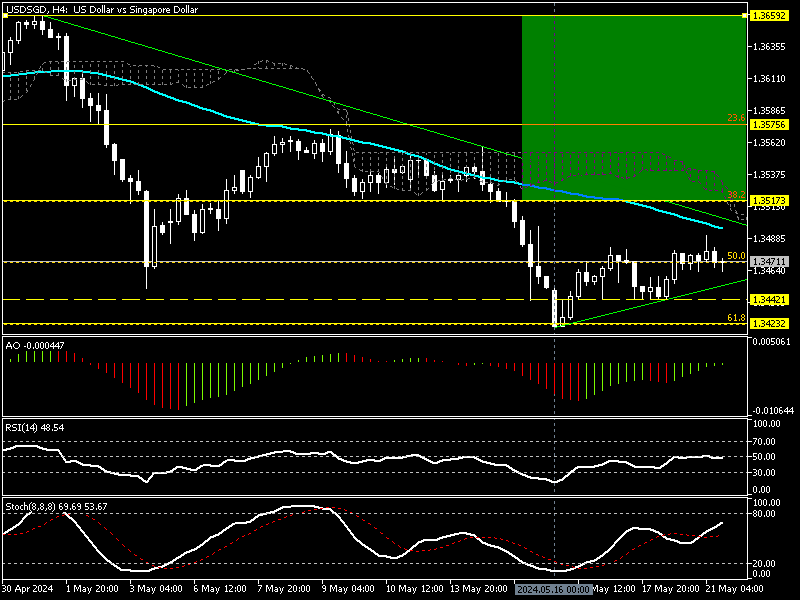
If the Bears close and stabilize the price below the ascending trendline and the immediate support at 1.344, the downtrend will likely resume. If this scenario comes into play, the downtrend might test May’s all-time low at 1.342. If the selling pressure increases, the next bearish target could be the 78.6% Fibonacci at 1.335.
The Bullish Scenario

The descending trendline is the immediate resistance level. If the bulls raise the price and break out from the ascending trendline and the 1.351 mark, the pullback from 1.342 could expand and aim for 23.6% Fibonacci at 1.357. In case of a breakout above 23.6%, the next bullish target could be April’s peak at 1.366.
USD/SGD Key Support and Resistance Level
Traders and investors should closely monitor the USD/SGD key levels below to make informed decisions and adjust their strategies accordingly as market conditions shift.
- Support: $1.344, $1.342, $1.335
- Resistance: $1.3517, $1.357, $1.366