USDZAR Forecast – February-1-2024

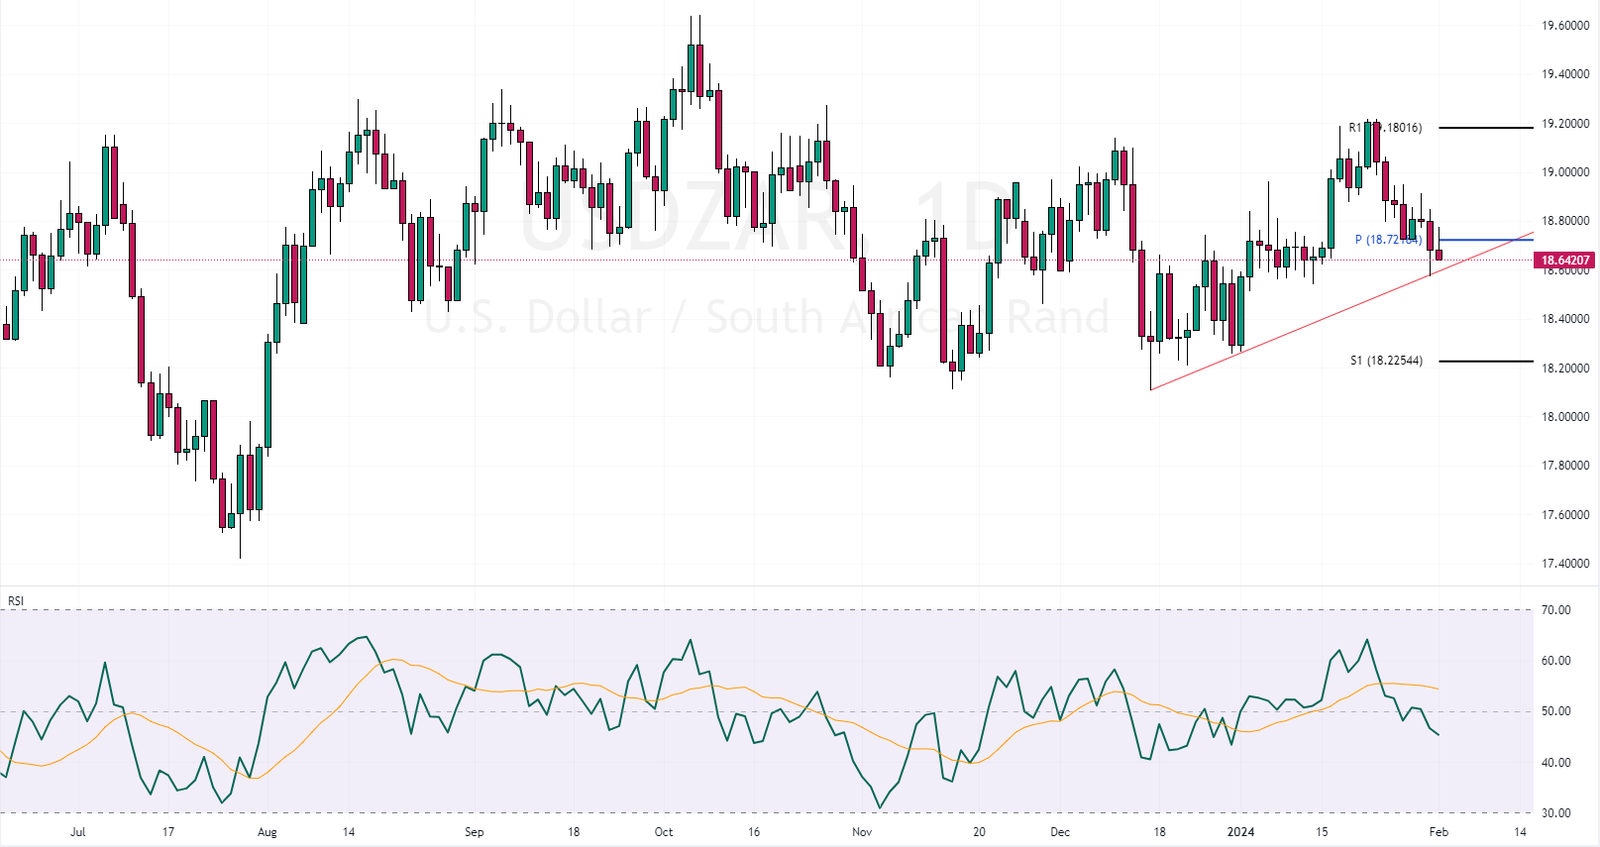
In today’s trading session, the USDZAR currency pair is trading below the monthly pivot, the 18.7 mark.

USDZAR Forecast – February-1-2024

The current USD/ZAR price is 18.6 at the time of writing. While the trend is bearish, bears test the trendline in red, as shown in the daily chart below. Interestingly, the relative strength index (RSI) indicator flipped below the 50 level, which can be interpreted as the downtrend will likely continue.
USDZAR Forecast - February-1-2024
USDZAR Forecast – February-1-2024 | Daily Chart

Insights from the 4-Hour Chart

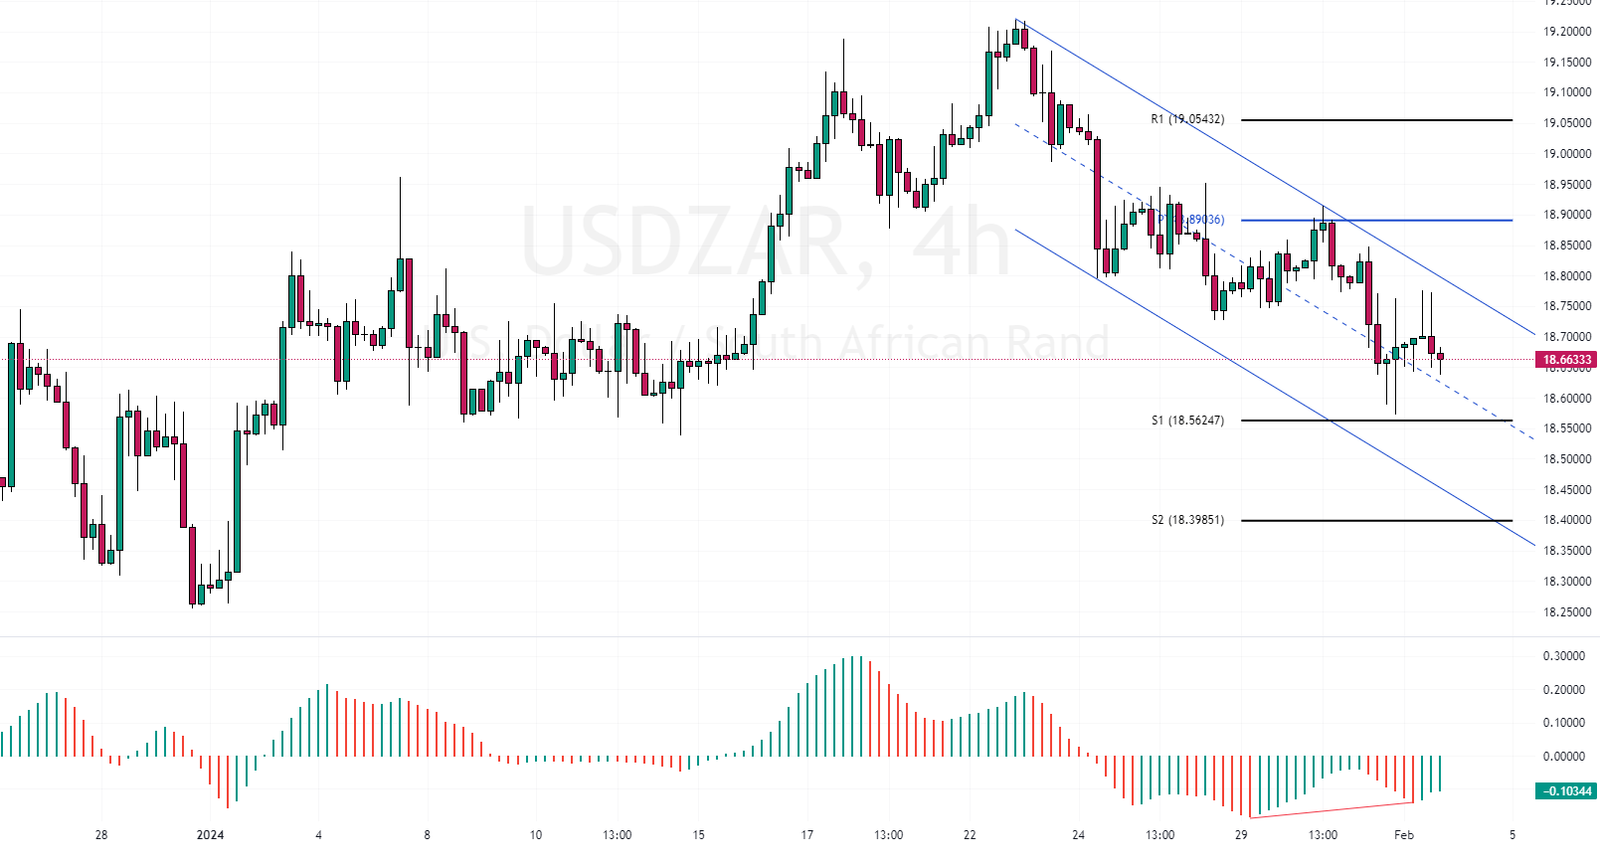
Zooming into the 4-hour time frame allows us to analyze the USDZAR chart from a closer perspective. The awesome oscillator divergence was further backed up by the S1 support, the 18.5 mark.

As a result, the pair experienced an uptick in momentum and tested the upper band of the bearish flag. However, bulls failed to maintain position, so the Chart formed a long wick candlestick pattern. This event can be interpreted as the bears being more active than the bulls in the market.
USDZAR Forecast - February-1-2024
USDZAR Forecast – February-1-2024 | 4-Hour Chart

From a technical standpoint, the downtrend remains valid as long as the USDZAR price trades below the 18.8 pivot. The S1 support, the 18.5, seems fragile and likely to be crossed by the USD sellers. If this scenario comes into play, the next target for the bearish trend would be S2, the 18.3 mark.

Conversely, the weekly pivot is what holds between the bearish trend and the bullish trend. The bearish trend should be considered invalid if the USDZAR price crosses the pivot and stabilizes itself above the 18.8 level. In this case, the USD price would rise to 19.2 resistance.

Latest Posts

Bitcoin Analysis: Technical, Fundamental & News

Discover the latest Bitcoin analysis with our expert insights....

GBPUSD Analysis: Technical, Fundamental & News

Discover the latest GBPUSD analysis with our expert insights....

EURUSD Analysis: Technical, Fundamental & News

Discover the latest EURUSD analysis with our expert insights....

EURUSD began consolidating from 1.017: rose 0.85%

EURUSD began consolidating from 1.017 and rose 0.85%, trading...

Litecoin Gained 7.1%: What’s the Next Target?

Litecoin gained 7.1%, marching slowly toward $100.0. The uptrend...

Gold Exceeded $2665: Now Overbought!

Gold exceeded $2665 resistance. However, robust buying pressure made...

Bullish Symmetrical Triangle Signals NATGAS Breakout

NATGAS trades sideways in a low-momentum market inside the...

Crude Oil Holds at $72.8 After Initial Price Dip

Crude Oil price dipped from $75.24, testing the %50.0...

Gold Stays Below $2665 Ahead of US Economic Data

On Monday, the price of gold remained below $2,665...

US Gasoline Futures Hit $2.07 Amid Oil Surge Amid Oil Surge

Gasoline futures in the US have climbed past $2.03...

NATGAS Dips 14% Amid Low Storage Draws

Natural gas prices in the U.S. fell sharply by...

WTI Crude Slips From $74 as Dollar Strengthens

Crude oil prices for West Texas Intermediate (WTI) dipped...

NATGAS is Hit $4 As the Year Ends

NATGAS hit $4.0, trading in a robust uptrend. The...