FxNews—In today’s XAGUSD technical analysis, we closely examine the recent price movements in the silver market and forecast the next direction for silver by analyzing the chart and its indicators.
XAGUSD Technical Analysis – Potential Correction
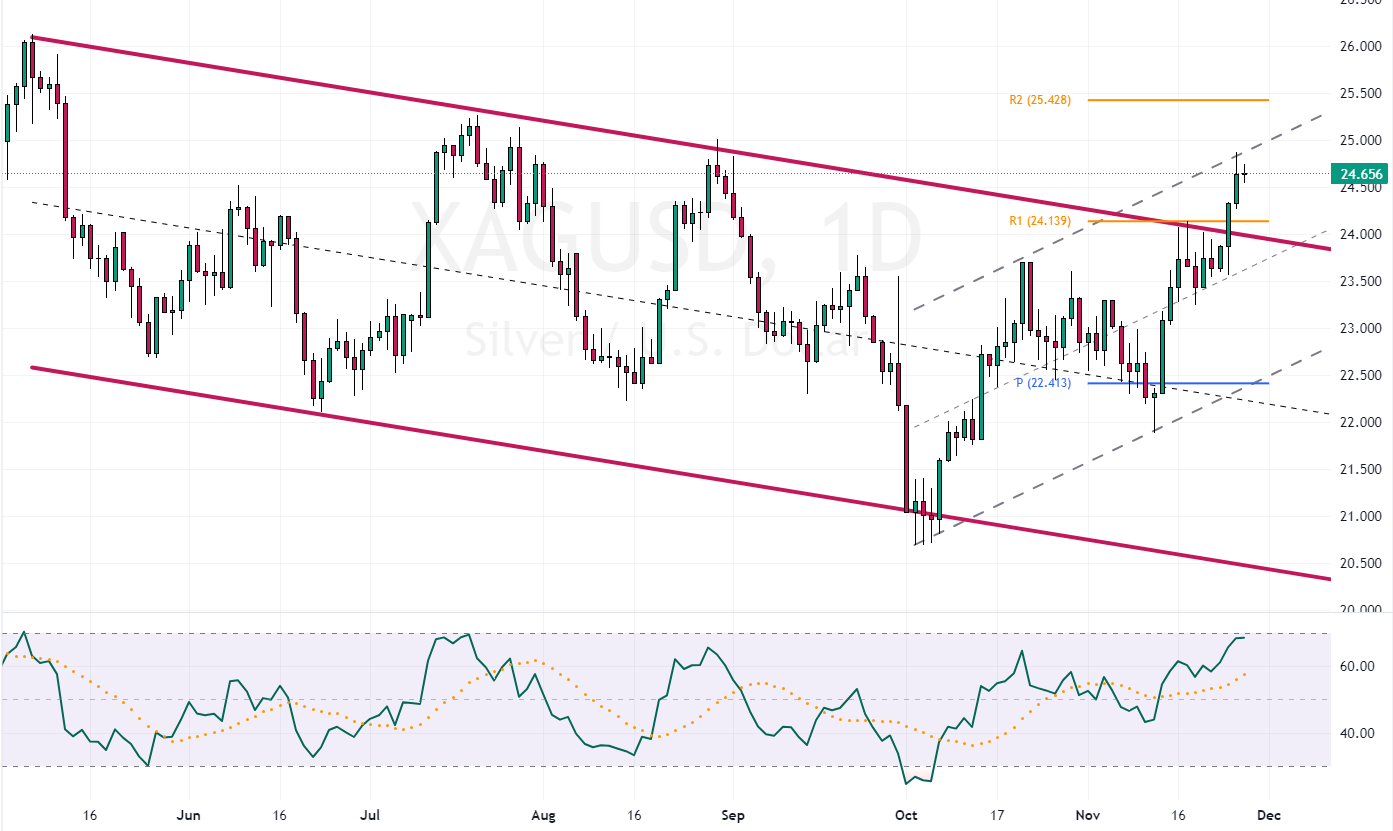
Silver, like Gold, has surpassed the bearish flag and breached the $24.1 resistance mark. It reached the top of the bullish flag but has since eased back, with the RSI indicator approaching an overbought state.

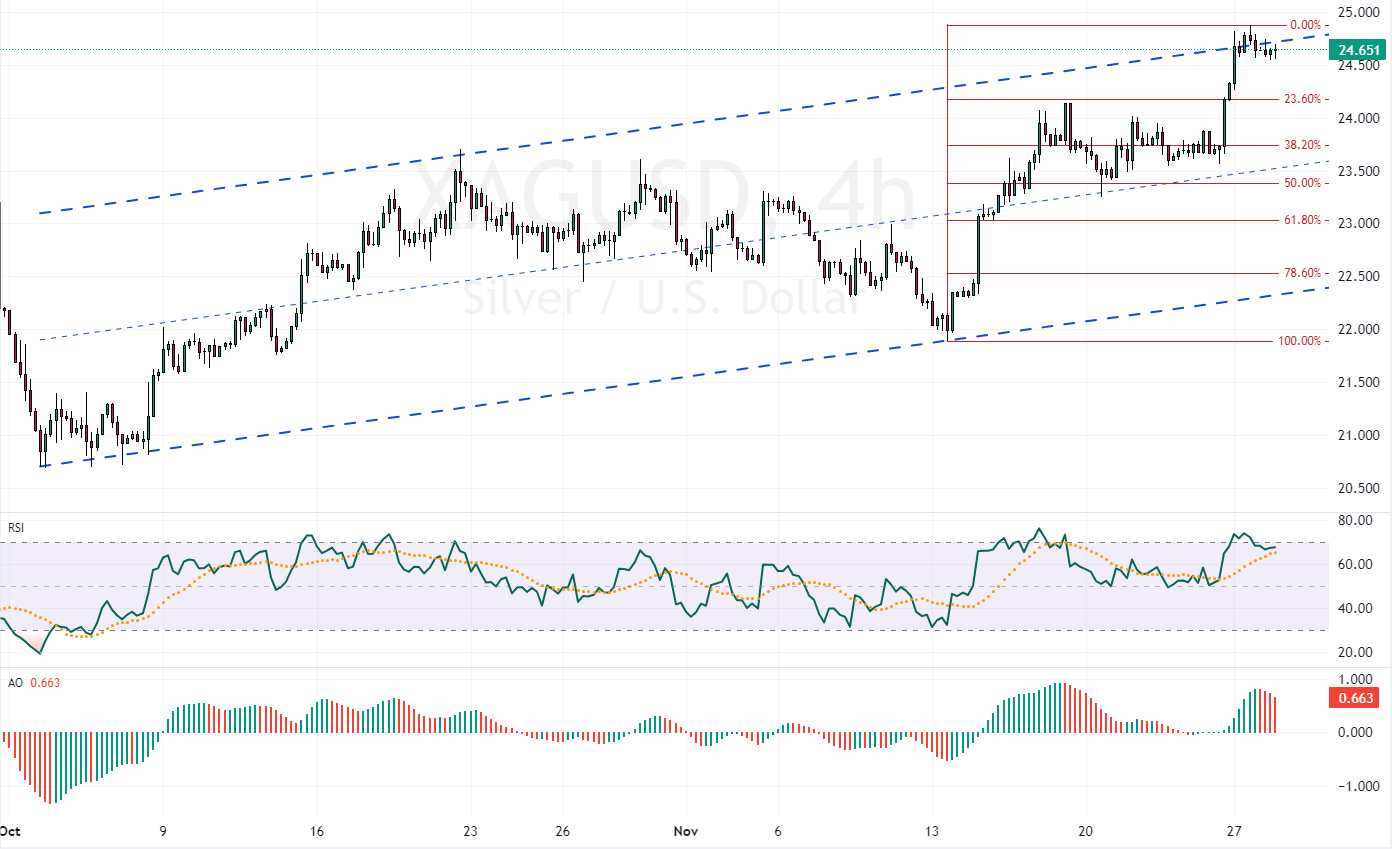
A closer look at the Silver 4-hour chart provides clearer insights into the XAGUSD technical analysis. The Awesome Oscillator and the overbought RSI indicate a potential correction.

Despite a bullish market, we advise retail traders against short selling at the current price. The 38.2% Fibonacci level or the median line of the bullish flag could offer a good entry point. Analysts at FxNews anticipate a correction phase for Silver, possibly leading to a loss in some of its recent gains toward the Fibonacci retracement levels.