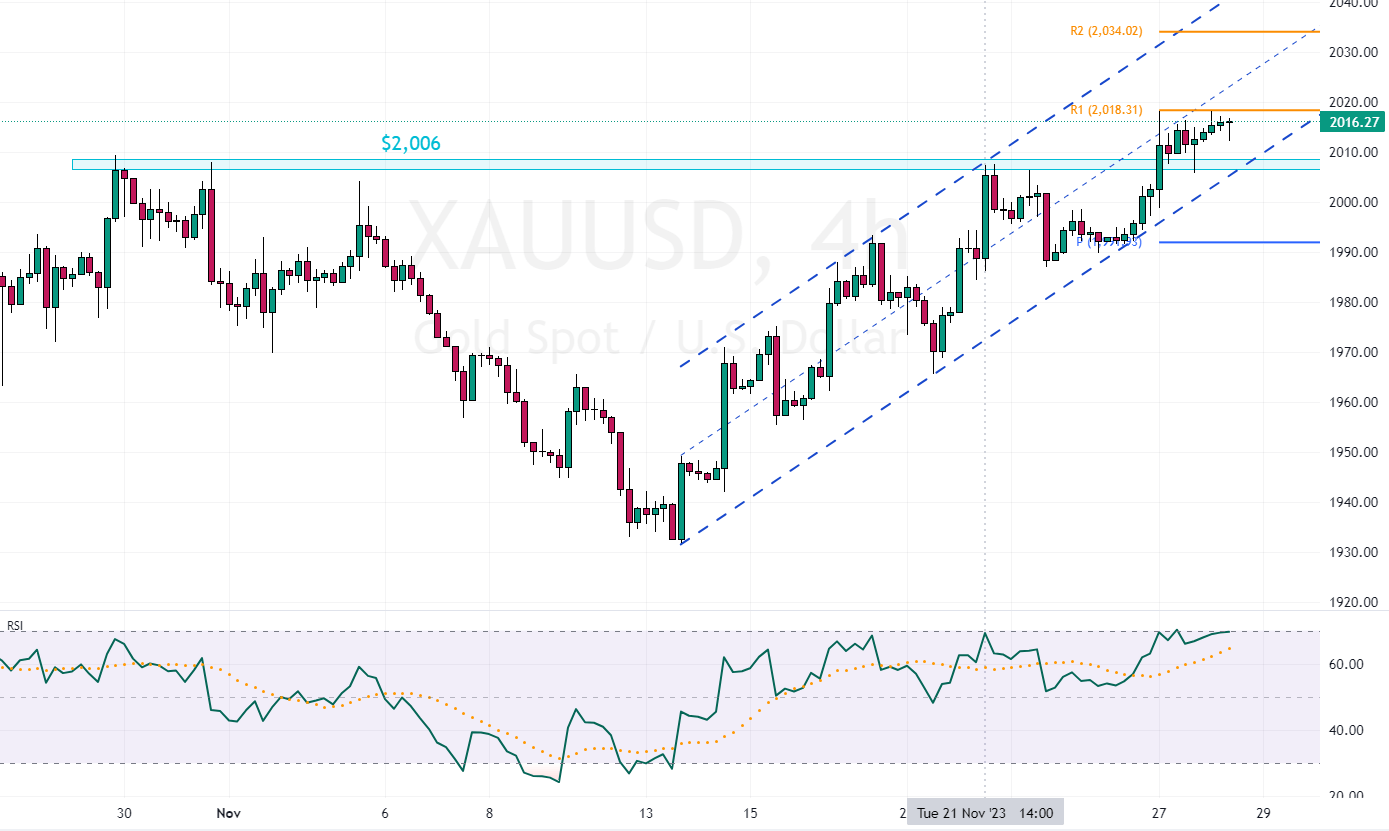
Today’s XAUUSD technical analysis focuses on the recent surge in gold prices. We’ll explore the details of this breakout and predict the next steps for the bullish trend. This will involve a thorough examination of the XAUUSD’s daily price movements and various indicators.
Gold Technical Analysis – A Deep Dive
FxNews – Gold recently soared past the significant $2,006 psychological level. It faces a challenge at the R1 weekly resistance, with its RSI indicator approaching the overbought zone. Although the trend for the XAUUSD pair seems positive, a minor pullback from recent highs is possible.

In today’s session, the pair might fluctuate between R1 and the $2,000 mark. Following this period of consolidation, the bulls could regain momentum and push the pair towards the R2 resistance, coinciding with the R2 weekly level.
The presence of a bullish flag pattern reinforces the upward trend. However, if the price dips below the flag, it could indicate a shift away from the bullish outlook, rendering the bullish XAUUSD technical analysis invalid.