In today’s comprehensive XRPUSD technical analysis, we will scrutinize recent news around Ripple and meticulously delve into the details of the technical analysis of the XRPUSD pair.
XRPUSD Technical Analysis – Price Rose Amid SEC Drops Charges
Bloomberg – On a recent Thursday, XRP, the fifth most valuable digital currency globally, experienced its most significant daily percentage increase in three months. This surge occurred after the U.S. Securities and Exchange Commission (SEC) decided to drop charges of securities violations against Ripple’s leading executives. XRP’s value climbed 6.5% to 52 cents, peaking at 53 cents before settling back to 51 cents, according to data from CoinDesk.
The SEC agreed to dismiss claims against Ripple CEO Brad Garlinghouse and co-founder Chris Larsen in a court document filed on Thursday. This decision follows the Southern District of New York’s statement that Ripple’s XRP offerings on digital asset exchanges did not constitute investment contract offers and sales as the SEC had previously alleged.
About three years ago, the SEC charged Ripple Labs, closely associated with XRP, with securities law violations for raising $1.3 billion through XRP sales to investors. This legal issue pressured XRP, even as the broader market was upward.
Spot market buyers likely drove Thursday’s XRP rally. Rallies fueled by spot markets are generally considered more sustainable than those led by leverage traders. Coinalyze data indicates that the cumulative volume delta (CVD) in spot exchanges increased alongside XRP’s price, suggesting a net market inflow. In contrast, the CVD in stablecoin and coin-margined futures markets remained unchanged.
XRPUSD Technical Analysis: Ripple’s Breakout
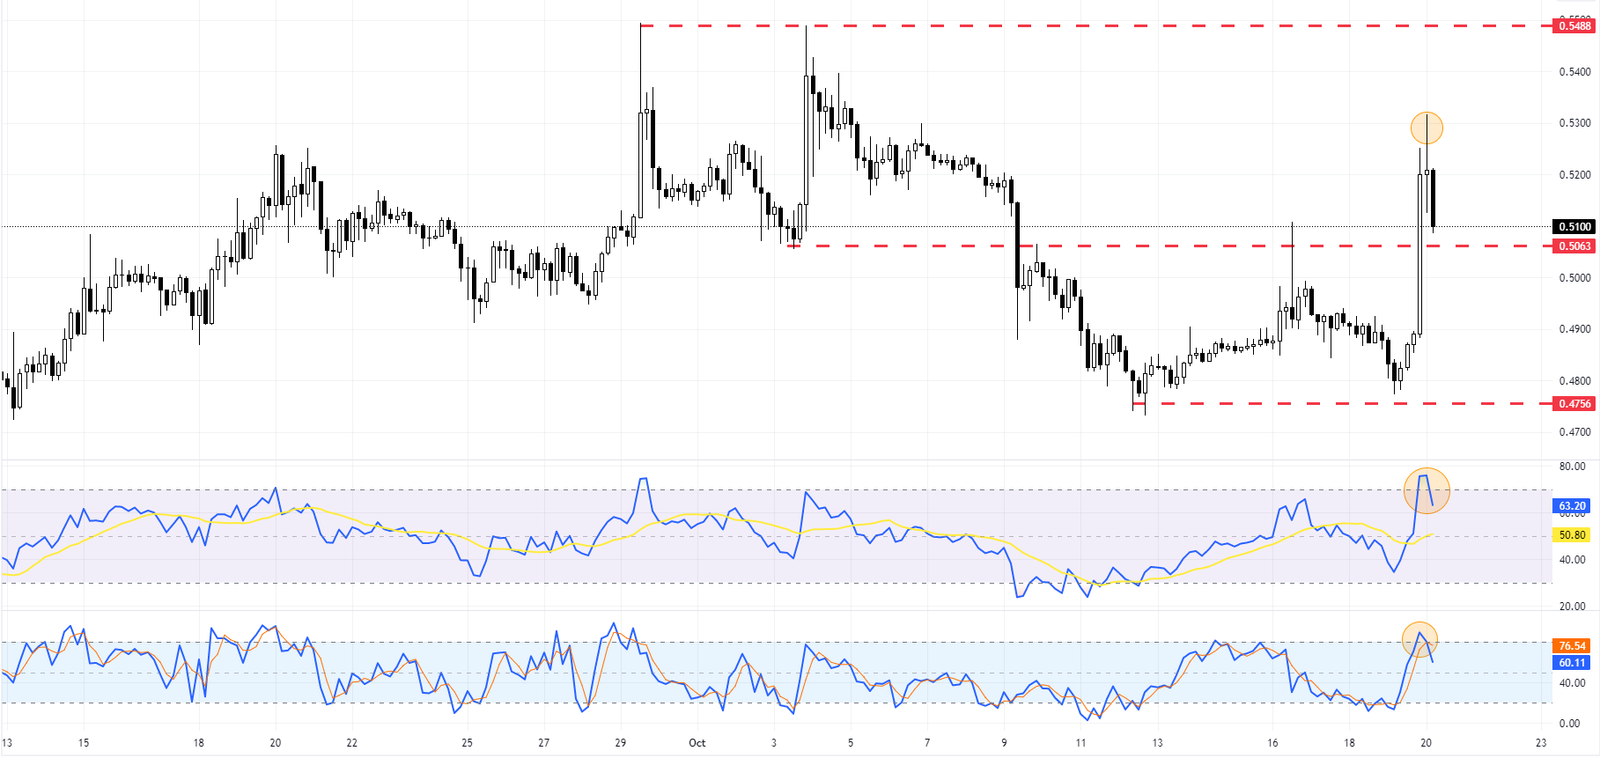
Ripple (XRP) recently experienced a significant breakout, surpassing the 0.53064 mark. This event led to a surge in momentum indicators, with the Relative Strength Index (RSI) and Stochastic Oscillator entering the overbought area. This is a clear indication of intense buying pressure and heightened investor interest. The recent news surrounding Ripple has added more volatility to the market. It’s important to note that market volatility can present both opportunities and risks for traders. High volatility often leads to more significant price swings, resulting in higher profits or losses.

Bearish traders have pressured the XRPUSD pair, forming a long-wick candlestick pattern. This pattern is often seen as a sign of a potential price reversal. The 0.5306 level is crucial as the primary support for the recent gains. As long as the XRP price remains above this level, bullish traders have a valid outlook for pushing the price towards 0.5488.
However, if bearish traders manage to close the XRP price below 0.5063, it could trigger a price drop targeting 0.477. This scenario underlines the importance of key support and resistance levels in determining potential market movements.
In conclusion, while Ripple’s recent breakout and the subsequent market volatility present potential opportunities for traders, it’s crucial to closely monitor vital technical indicators and market news to make informed trading decisions.