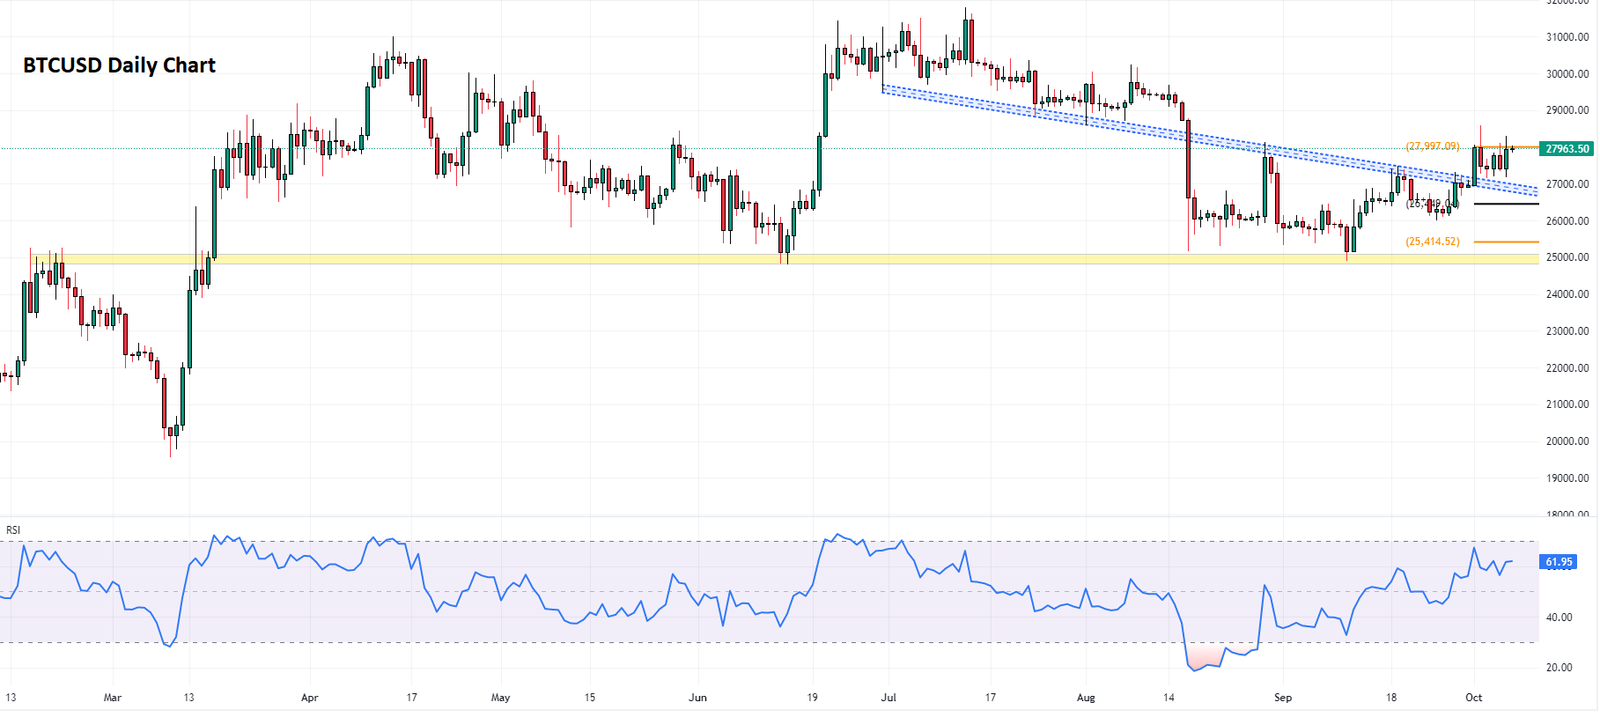
Our latest cryptocurrency Market Analysis targets a potential 5% increase in Bitcoin’s value. Since mid-September, Bitcoin (BTC) has been recovering, bouncing back from a low of $25,114. Despite several unsuccessful attempts to overcome this, it’s facing a significant challenge at the $28,096 mark. However, it’s worth noting that there’s robust support from the 100-day Exponential Moving Average (EMA) at $27,350.
Should Bitcoin break through the $28,096 barrier, we could see it ascend by 5% to reach the supply zone at the psychologically significant $29,000 mark. A firm conversion of this resistance area into a bullish breaker could pave the way to the $30,000 mark. In bullish scenarios, it could stretch to the range high of $31,508 – indicating a 13% rise from current levels.

The Relative Strength Index (RSI) appears ready to continue its upward trajectory if it stays above 50. Simultaneously, the Awesome Oscillator (AO) remains in positive territory, suggesting an increased potential for BTC’s value to rise. However, if Bitcoin faces further rejections at the $28,096 mark and skeptics decide to cut their losses, we could see a pullback in Bitcoin’s price.
This could push BTC below the 100-day EMA at $27,349 or even lower to breach the 50- and 200-day EMAs at $27,054 and $26,990, respectively. In a worst-case scenario, a retest of the $26,000 psychological level might be on the cards. This would disprove the bullish thesis and trigger a new downtrend towards the $25,114 support level.
Ethereum Technical Analysis
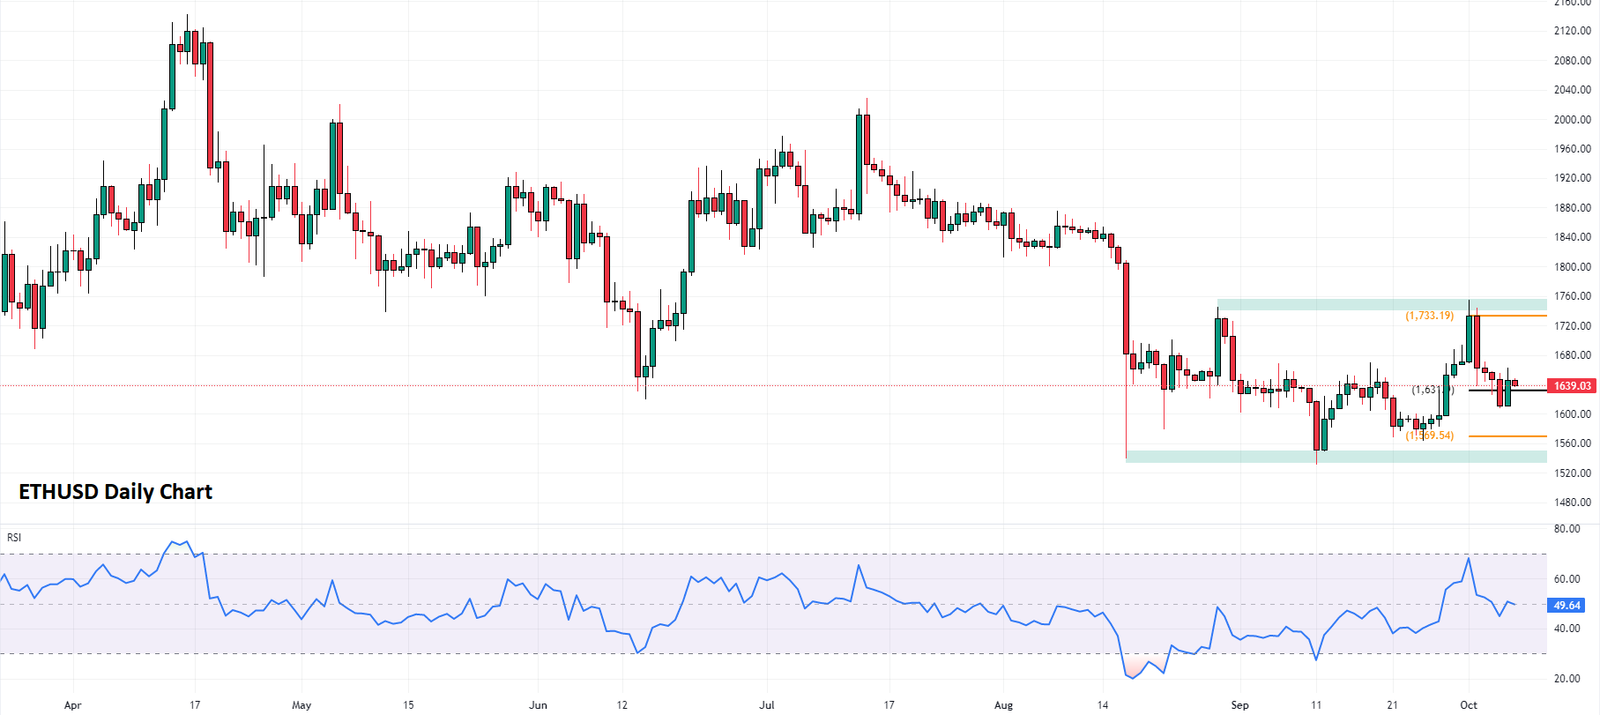
Our Ethereum Market Analysis closely monitors a potential 5% increase in Ethereum’s (ETH) value. Currently, ETH is on standby for a buy signal, which will be activated once the Relative Strength Index (RSI) crosses decisively above the signal line (represented by the yellow band).
For traders who respond to this signal, ETH could break through the immediate barrier at $1,648. If market conditions are particularly bullish, Ethereum’s value could surpass the 50-, 100-, and 200-day Exponential Moving Averages (EMA) at $1,664, $1,710, and $1,729, respectively. This could lead to Ethereum clearing equal highs at $1,736.

However, if Ethereum faces rejection at the $1,648 mark, its value could fall into the demand zone between the $1,603 and $1,569 order block. If it breaks and crosses below the midline of this zone at $1,585, it would disprove the bullish thesis and potentially send the Proof-of-Stake token down to $1,551.