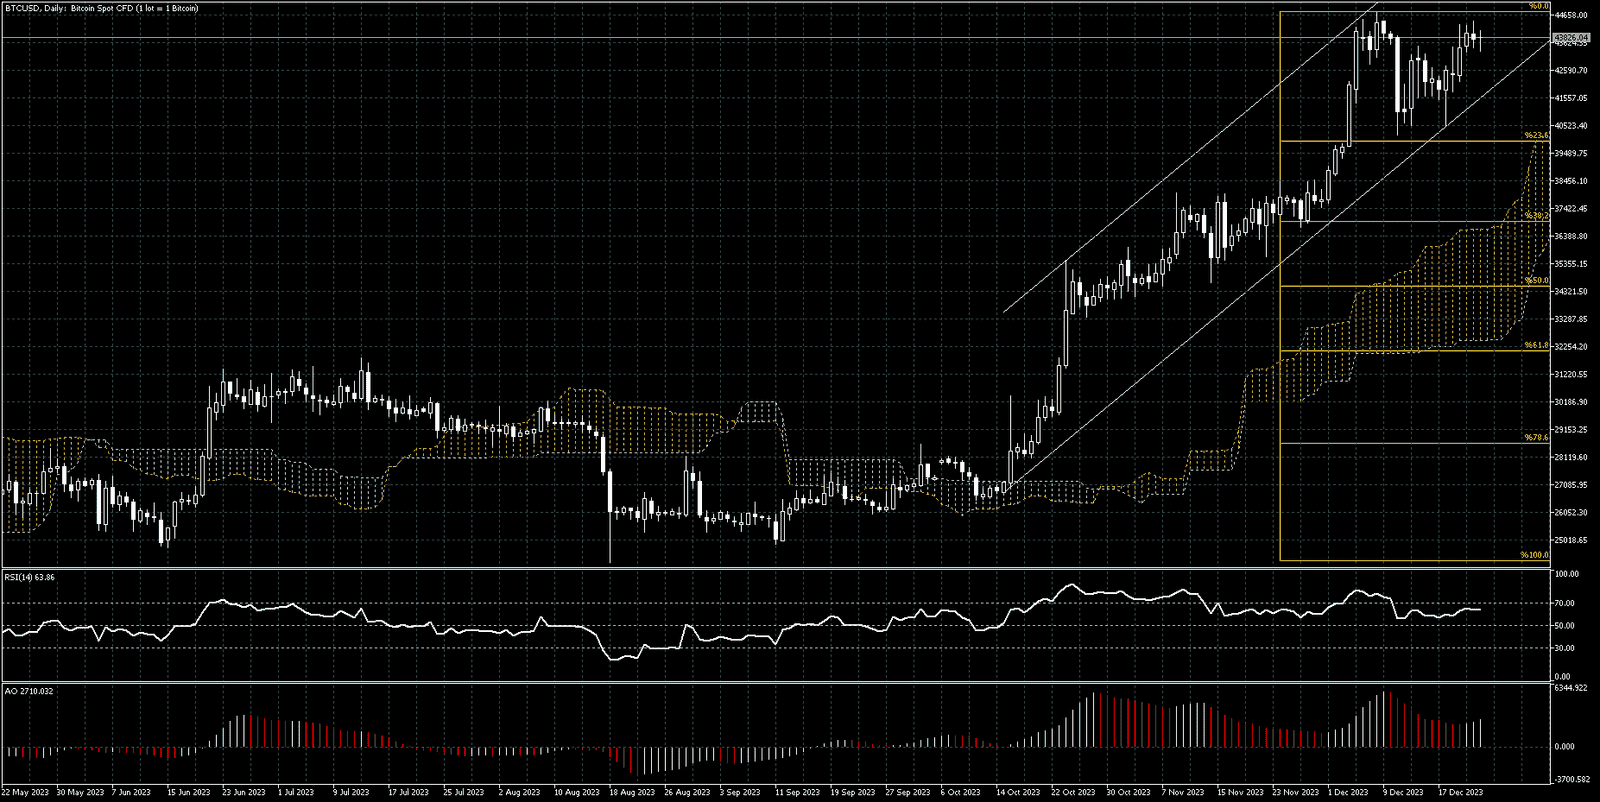
In today’s comprehensive Bitcoin technical analysis, we will first examine the currency pair’s price action in the daily chart. Then, we will explore the technical indicators and key Fibonacci levels to see what could be next for the BTCUSD.
FxNews—Bitcoin’s price increased in the bullish channel after the digital gold was tested at the 23.6% Fibonacci retracement level with a double bottom pattern. The bitcoin price is currently nearing the December high, the $44,786 mark.
Our popular technical indicators give exciting signals. The Awesome Oscillator shows a divergence signal. This indicates that the Bitcoin price may step into a consolidation phase or experience a price dip.
The December high plays a resistance role in our Bitcoin technical analysis. Analysts at FxNews advise patience for the bullish traders. The BTCUSD is overvalued at this time. With the year ending, there will be a shrinkage in the market liquidity. Therefore, we suggest that bulls consider one of the following options when entering the market:

We suggest that the Bitcoin buyers consider one of the following scenarios for entering the bullish wave.
- A break above the December high could signal the continuation of the upward trajectory. When this resistance is breached, the way to $48,000 will likely be paved.
- The second plan to join the bullish wave is to wait for a pullback to lower levels. We have a divergence signal from the Awesome oscillator that might lead to a price decline. If this technical analysis continues, the 23.6% Fibonacci level can provide a decent price for going long on the digital currency.
Forex traders must monitor the price action and candlestick patterns near the key levels to make informed trading decisions. Therefore, stay with us to receive the latest analysis on the Bitcoin market.