...

USDCZK Forecast – February-5-2024

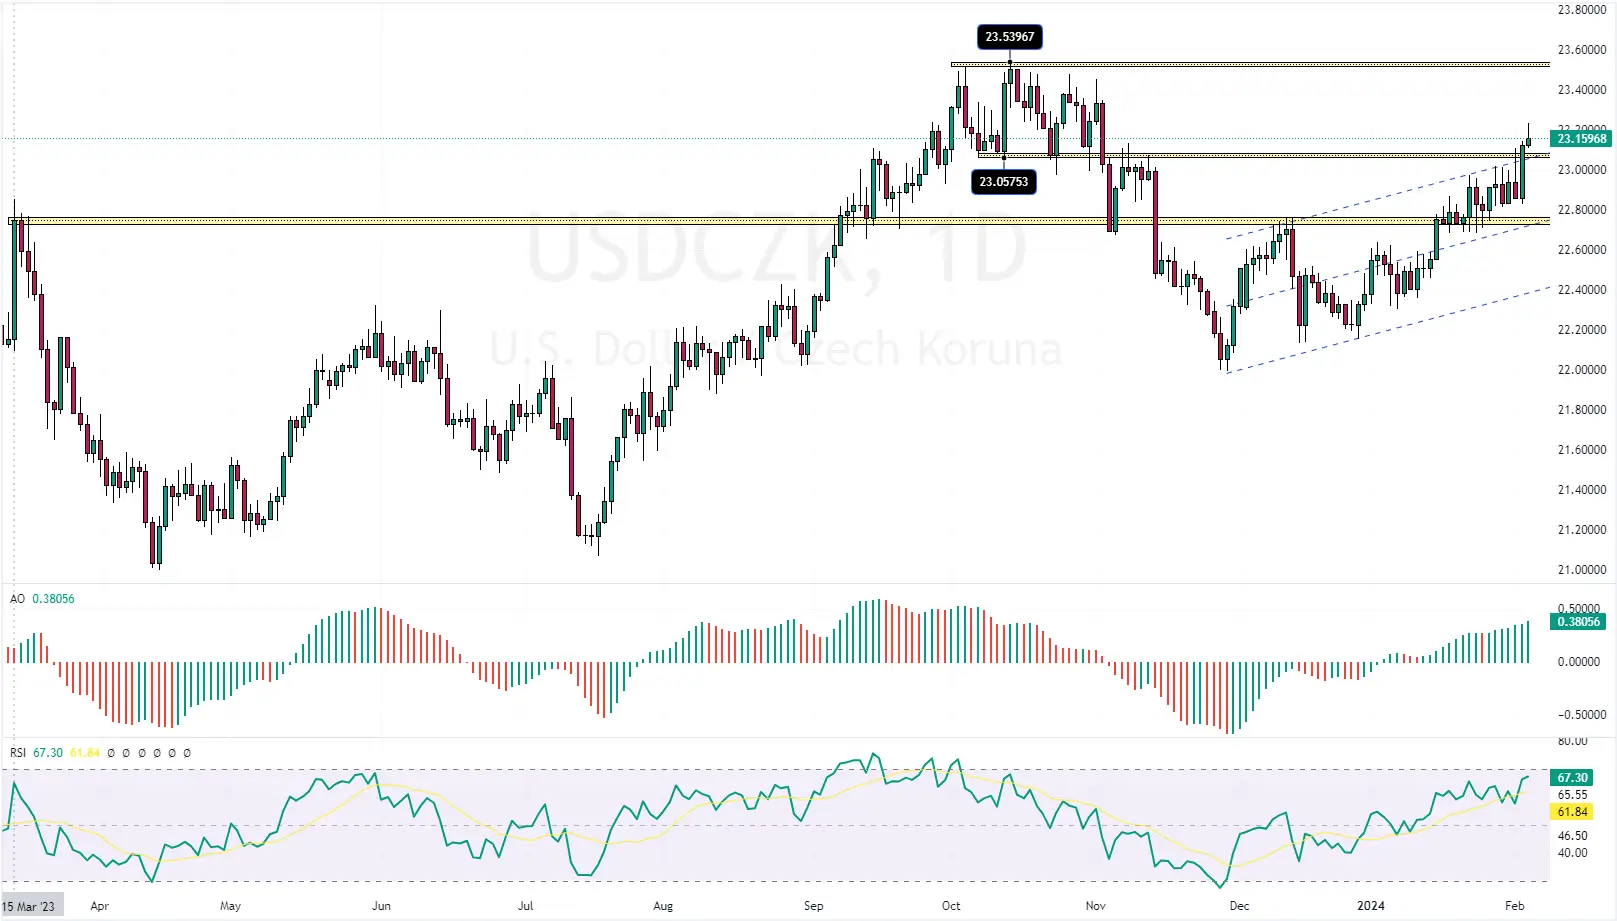
The USDCZK (U.S. dollar vs. Czech Koruna) exchange rate trades around 23.1 during Monday’s trading session. The U.S. dollar price significantly increased on Friday, crossing above the bullish flag and the 23.05 resistance.

USDCZK Forecast – February-5-2024

Technical indicators are signaling a bullish trend. The awesome oscillator‘s bars are green, but the RSI indicator is approaching the overbought area. Therefore, the USDCZK price has some room for further increase in value.
USDCZK Forecast - February-5-2024
USDCZK Forecast – February-5-2024 | Daily Chart

The Bullish Trend Analysis and Predictions

USDCZK Forecast - February-5-2024
USDCZK Forecast – February-5-2024 | 4-Hour Chart

We zoom into the 4-hour chart to better understand the possible scenarios.

The USDCZK currency pair formed a long wick candlestick pattern in today’s trading session after the price reached as high as 23.27. The RSI indicator is crossing into the overbought area; therefore, we might encounter an overbought situation soon.

Since the pair broke the 23.05 resistance, the road to the 23.53, the October high, is paved. However, the market is saturated with buying pressure and might see some pullbacks. Therefore, we suggest waiting for a price to consolidate near the 23.6% level of Fibonacci retracement, the 23.0 mark.

Conversely, the bullish outlook should be invalidated if the USDCZK price falls below the 38.2% level of Fibonacci retracement, which is the 22.8 mark.

Latest Posts

Gold Dipped Below $2667 Awaiting Direction

Gold traded sideways after it dipped below $2,667 and...

Gas Prices Dip Under $1.99 Amid Bearish Signs

Gasoline prices dropped below $1.99, which is active resistance....

Natural Gas Rebound Targets $3.24 and Beyond

U.S. natural gas bounced from $3.1, hinted by Stochastic's...

Crude Oil Head and Shoulders Signals Downward Trend

Crude oil formed a head and shoulders pattern in...

Inverted Hammer Hints at USDJPY Consolidation Ahead

USD/JPY trades bullish amid overbought signals. The 4-hour chart...

Gold Dipped Below $2667 Awaiting Direction

Gold traded sideways after it dipped below $2,667 and...

Gas Prices Dip Under $1.99 Amid Bearish Signs

Gasoline prices dropped below $1.99, which is active resistance....

Natural Gas Rebound Targets $3.24 and Beyond

U.S. natural gas bounced from $3.1, hinted by Stochastic's...

Crude Oil Head and Shoulders Signals Downward Trend

Crude oil formed a head and shoulders pattern in...

WTI Falls Below $71.5 on New Sanctions Against Russia

WTI Crude Oil prices fell slightly below $71.5 a...

Watch for Potential Drop in Gasoline Prices Below $2

FxNews—Gasoline is bullish. However, a dip below $1.99 could...

NATGAS Tests Critical Resistance: Bears Target $3.21

FxNews—The U.S. Natural Gas trades bullish above the %50.0...

Bullish Crude Oil Signals Overbought at $70.5

FxNews—Crude Oil trades bullish, above the 75-period simple moving...