FxNews—Ethereum is stabilizing itself above SMA 50 and 100, and the Ichimoku cloud against the U.S. Dollar traded at about $3,840 in today’s trading session. This development in the ETH/USD price suggests that the uptrend will likely resume.

Ethereum Technical Analysis – 6-June-2024
The technical indicators suggest Ethereum is in a sideway market with bullish momentum. Furthermore, the price is above the Ichimoku cloud, and the simple moving averages of 50 and 100 signifying the bullish trend prevails.

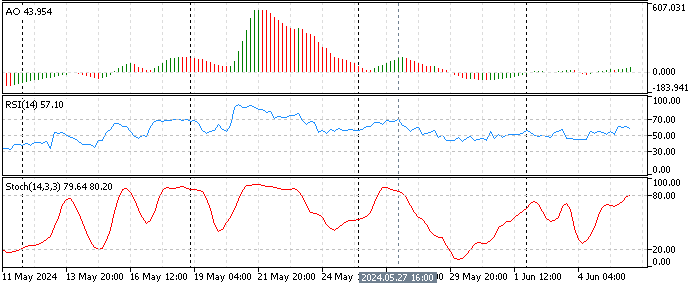
- The awesome oscillator bars are small and above the zero line, depicting 43 in the description. This growth in the AO value means the ETH/USD is in a mild uptrend.
- The RSI indicator value is 54 and above the median line, signifying the bullish momentum could strengthen.
- The Stochastic %K line value approaches the overbought territory, currently recording 80 in the description. This development in the %K line indicates that the market might become overbought soon.
ETH/USD Forecast – 6-June-2024
The critical support for the current uptrend is the 23.6% Fibonacci level at $3,705. The uptrend will remain valid as long as the Ethereum price hovers above the key support level. In this scenario, the next bullish target is the May all-time high at $3,980.
If the buying pressure exceeds the critical resistance level at $3,980, the road to the Match’s peak at $4,097 will likely be paved.
Bearish Scenario
On the flip side, if the bears push the Ethereum price below the critical support level at $3,705, the consolidation phase started on May 27 could extend to the 38.2% Fibonacci at $3,534. Also, this level is below the Ichimoku cloud, meaning the trend could reverse from a bull market to a bear market. If the dip exceeds $3,534, the 50% Fibonacci at $3,397 will be the next bearish target.
Ethereum Key Support and Resistance Levels
Traders and investors should closely monitor the key levels below to make informed decisions and adjust their strategies accordingly as market conditions shift.
Support: $3,705 / $3,534
Resistance: $3,980 / $4,097
Disclaimer: This technical analysis is for informational purposes only. Past performance is not necessarily indicative of future results. Foreign exchange trading carries significant risks and may not be suitable for all investors. Always conduct your research before making any investment decisions.