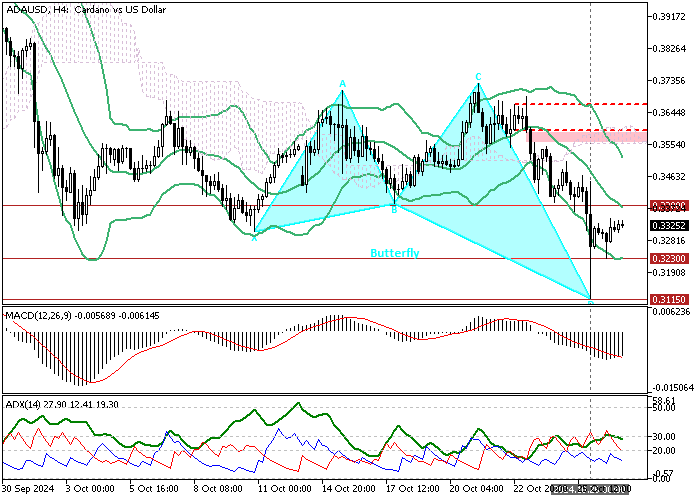
FxNews—Cardano‘s downtrend eased when the price hit the September 9 low at $0.311. Robust selling pressure drove the Stochastic Oscillator into oversold territory, justifying the price pullback from the $0.311 low.
As of this writing, the ADA/USD crypto pair is consolidating at approximately $0.333, slightly below the October 17 low ($0.338).

Cardano Technical Analysis
The 4-hour chart formed a Butterfly harmonic pattern, indicating the trend could reverse or it has the potential to consolidate near the upper resistance levels. Additionally, the ADX indicator demonstrates active momentum in the market by recording 19 in the description.

Additionally, the Awesome Oscillator histogram is green, rising toward the signal line, meaning buyers are adding new bids to the price.

That said, the primary trend remains bearish because the price is below the 50- and 100-period simple moving averages.
Overall, the technical indicators suggest while the primary trend is bearish, Cardano’s price can potentially increase toward the upper resistance areas.
- Also read: Litecoin Retreats from $71.5 Fair Value Gap
Cardano Price Forecast

The immediate resistance rests at $0.338 (October 17 Low), backed by Bollinger Bands median line. From a technical perspective, the uptick momentum from $0.311 could target the 50-period SMA, backed by the descending trendline at $0.347, if ADA/USD holds above the $0.323 immediate support.
Please note that the bullish outlook should be invalidated if bears push Cardano’s price below $0.323. If this scenario unfolds, the downtrend will likely resume, and sellers could initially aim for $0.3115, the October 26 low.
Furthermore, if the selling pressure exceeds $0.3115, the bears’ path to $0.275, the 2024 all-time-low will likely be paved.
Cardano Support and Resistance Levels
Traders and investors should closely monitor the key levels below to make informed decisions and adjust their strategies accordingly as market conditions shift.
- Support: 0.323 / 0.3115 / 0.275
- Resistance: 0.338 / 0.347 / 0.358