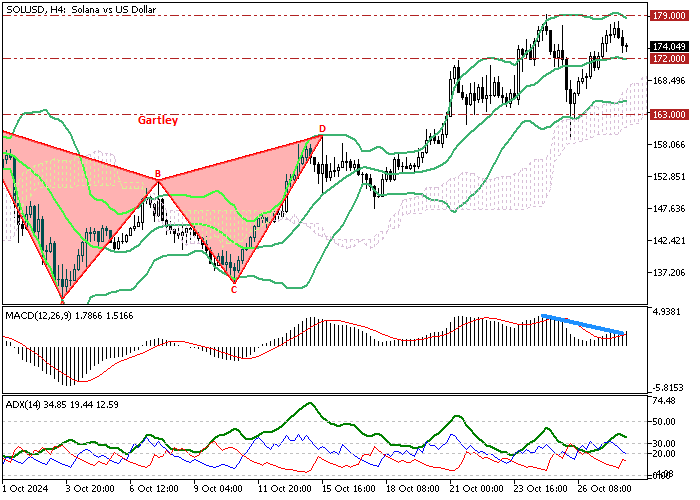
FxNews—Solana trades bullish, but the uptrend eased near the October 25 high at $179.0. As of this writing, the SOL/USD crypto pair has begun a downtick, declining toward $172.0, the October 21 high.
The 4-hour price chart below demonstrates the price, support, resistance levels, and technical indicators used in today’s analysis.

Stochastic Oscillator: Solana Reaches Overbought Status
Robust buying pressure drove the Stochastic Oscillator into the overbought zone, signaling that Solana is overpriced in the short term. In addition to the Stochastic, the Awesome Oscillator signals divergence, meaning the trend can potentially drop to lower support levels.

Interestingly, the MACD histogram also signals divergence, backing the AO’s signal. Furthermore, the ADX indicator is above the 20 level, indicating the market has momentum.
Overall, the technical indicators suggest the primary trend is bullish, but Solana’s price can potentially drop and visit the lower support levels.
- Editor’s pick: Litecoin Retreats from $71.5 Fair Value Gap
Watch Solana at $172 Support Level

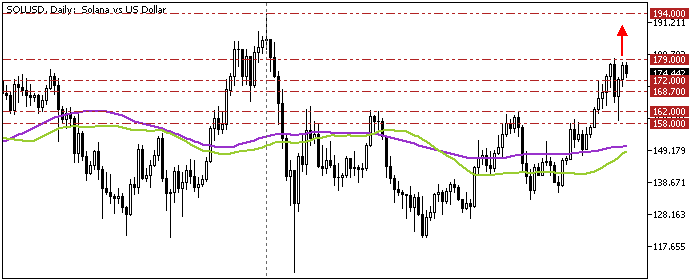
Our previous Solana analysis (Solana Eyes $194 Despite Overbought Signals) stated that the immediate support is at the October 21 high, the 172.0 mark, which still stands valid. From a technical perspective, the consolidation phase from $179 will likely extend to the 50-period simple moving average at 168.7.
Furthermore, if the selling pressure exceeds 168.7, the next bearish target could be the October 15 high at 158.0. Please note that the bearish outlook should be invalidated if Solana’s price exceeds $179.
Solana Bullish Scenario

The immediate resistance rests at the October 25 high, 179.0. If buyers pull the price above this mark, the bullish wave from last week has the potential to extend to the July 29 high, the 194 mark.
Solana Support and Resistance Levels
Traders and investors should closely monitor the key levels below to make informed decisions and adjust their strategies accordingly as market conditions shift.
- Support: 172.0 / 168.7 / 162.0
- Resistance: 179.0 / 194.0