In today’s Forex workshop, we will first examine the price action of the EURCAD currency pair on the daily chart. Then, we will scrutinize the technical indicators and key support and resistance levels to determine the EURCAD forecast and what could be next for the pair.
Forex Workshop – A EURCAD Forecast and Technical Analysis
FxNews—As of this writing, the EURCAD price is 1.6219, 0.15% higher than yesterday’s closing price. To begin our EURCAD forecast, it’s essential to identify key levels such as support, resistance, pivot points, and Fibonacci levels. My preferred timeframe for marking these key levels is the daily chart. It provides broad insight and is significantly helpful in identifying critical support and resistance levels.
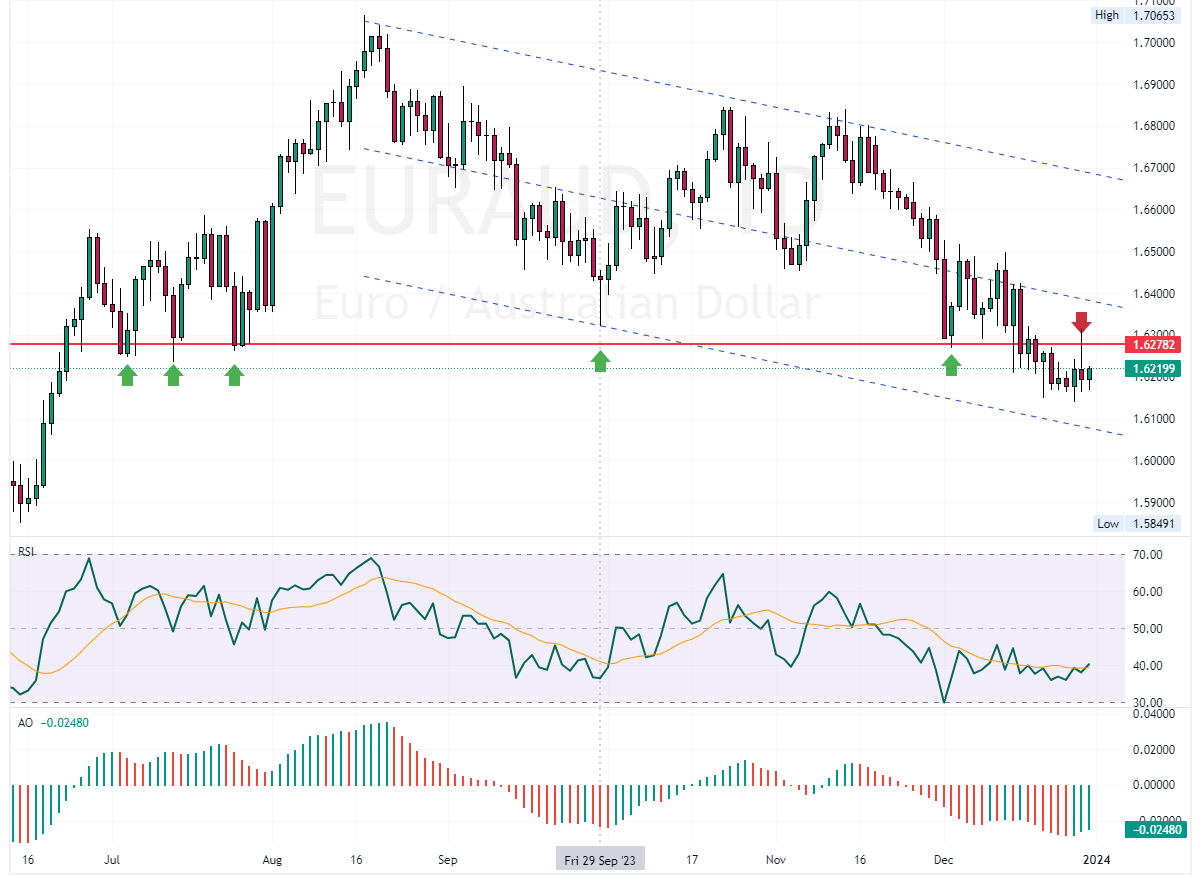
The EURCAD daily chart below shows that our key resistance level is 1.6278. The market has reacted to this level six times, as indicated by the arrows in the image.

The 1.6278 resistance level held firm against yesterday’s bullish momentum, leading to a price retraction. Interestingly, this formed a long wick candlestick pattern on the chart.
The next step in our EURCAD forecast is to determine the trend direction. There are several tools that traders can utilize for this purpose, including moving averages, the envelopes indicator, or Bill Williams’ alligator. However, in this technical analysis, I am using a channel. To draw a channel on a forex chart, connect two parallel lines: one along the swing highs (resistance) and the other along the swing lows (support). Ensure the lines are parallel to each other.
The image below shows that the EURCAD price trades within a bearish channel. We conclude that the market trend is bearish so that we will focus on short trades.

The EURCAD 4-hour Chart Technical Analysis
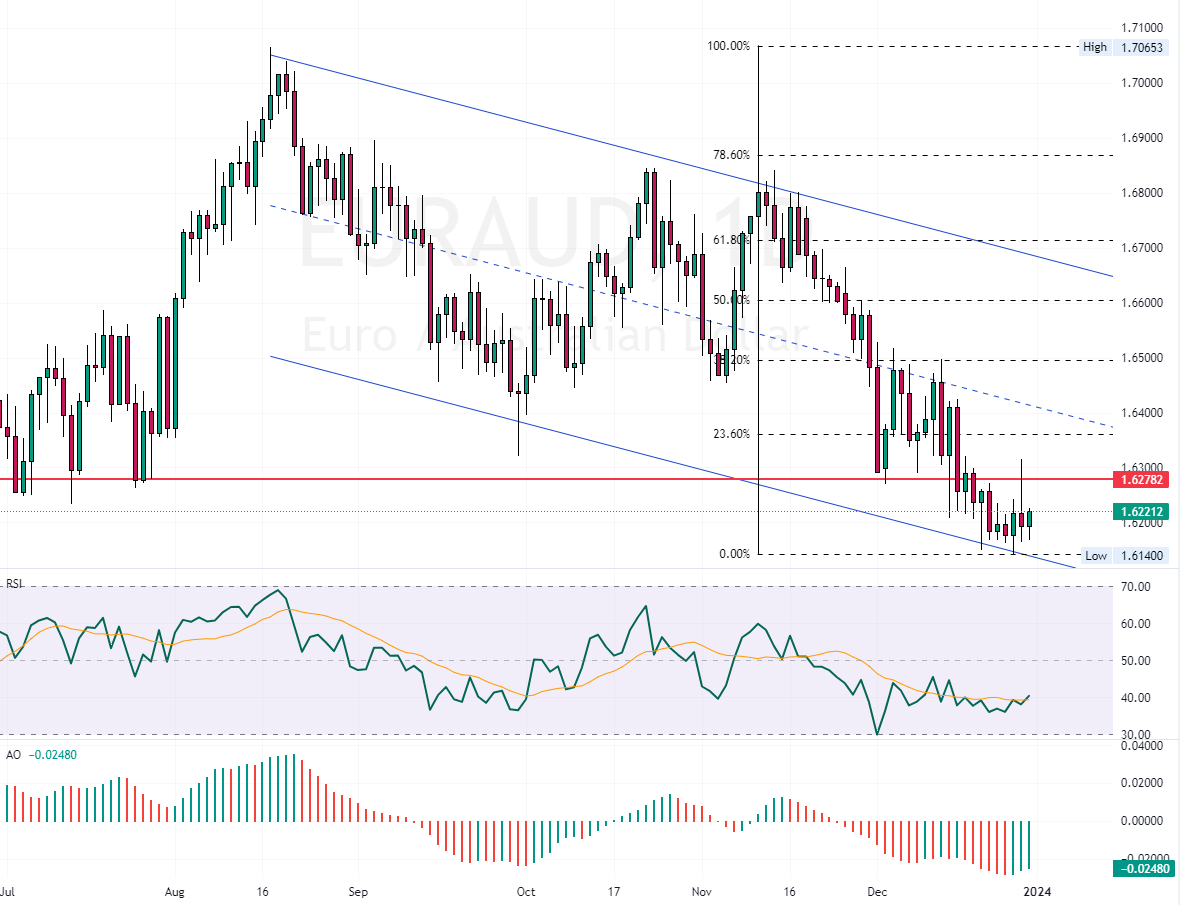
I zoomed into the 4-hour chart for a more detailed insight into the price action. I repeat the same technical analysis for the 4-hour chart to ensure both timeframes align and do not provide conflicting signals.

A new channel has been added to the 4H chart. As illustrated, the market trend is also within a bearish channel. However, the awesome oscillator signals divergence, raising my concern about a potential trend reversal or consolidation phase. Concurrently, the RSI indicator hovers above the middle line, signaling weak bullish strength.
This technical analysis shows that while the market trend is bearish, the technical indicators suggest a potential trend reversal or consolidation phase.

Final Thoughts
The key support level is at 1.61, which has been tested twice. The first bounce from this level occurred on December 20, followed by another on December 23, 2023. As long as this level holds, the EURCAD price may rebound and test the upper band of the bearish flag in the 4-hour chart. This level is further supported by the 23.6% Fibonacci resistance at 1.6308.
In line with the main market trend, which is bearish, we can plan an entry point around this level. From a technical analysis standpoint, traders should look for bearish candlestick patterns if the price rises to the 23.6% Fibonacci resistance.