In today’s comprehensive GBPUSD technical analysis, we will first scrutinize the currency pair’s price action. Then, we will meticulously delve into the trading asset’s fundamental analysis.
GBPUSD Technical Analysis – December Key Resistance
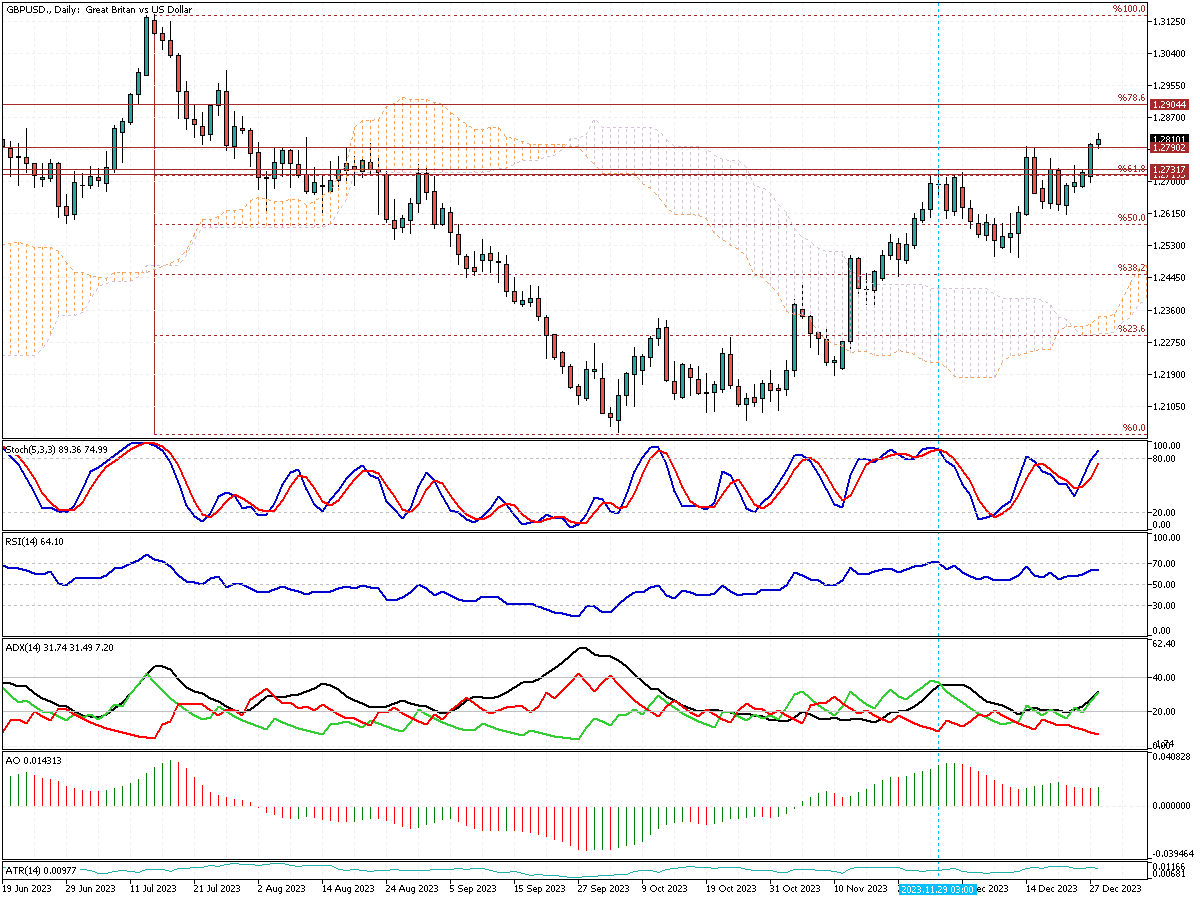
The GBPUSD buyers have successfully closed the price above the 1.2790 resistance in today’s trading session. Interestingly, breach 1.2790 coincided with the Stochastic oscillator signaling an overbought condition. This aligns with rising speculations of rate cuts, highlighting the dollar’s vulnerability. Consequently, the RSI also exceeded 70, further indicating an overbought market.
Currently, the GBPUSD price is testing the 1.2790 support, a level that served as resistance.

Upon analyzing the GBPUSD chart, our forecast presents bullish and bearish scenarios and a notable entry point.
GBPUSD Analysis: The Bullish Scenario
The GBPUSD’s uptrend may persist if support is maintained above 1.2790. Should this hold, the next target is the 78.6% Fibonacci level at 1.2904.

GBPUSD Analysis: The Bearish Scenario
Should the current bearish pressure, which appears temporary, persist and the price crosses the support level below, we might consider the bullish wave to be on pause. Currently, the ATR value stands at 26 pips. A dip to 1.2764 could effectively counter today’s bullish momentum.
In this bearish scenario, a deeper decline is expected, targeting the lower band of the bullish flag, supported by the Ichimoku cloud and the November 2023 peak.

ATR Role in GBPUSD Technical Analysis
The ATR, a volatility indicator, currently stands at 0.0026 or 26 pips. This implies an average movement of 26 pips for GBPUSD. Hence, a drop exceeding 26 pips below the resistance (1.2764) would indicate a broken level. This insight aids in avoiding false breakout trades.
United Kingdom: FTSE 100 Rises
Bloomberg—The FTSE 100 witnessed an uplifting trend, primarily driven by the market’s anticipation of interest rate reductions from major central banks in the coming year. This optimism was reflected in various sectors.
Industrial metal miners saw a modest yet notable increase of 0.3%, signifying a stable growth trajectory. The personal goods sector also boosted, ticking up by 0.4%. The pharmaceutical and life insurance sectors rose more, each climbing by 0.5%. These increases highlight the positive market sentiment and its diverse impact.
Additionally, the real estate investment trust sector and the automobile industry recorded impressive gains of 1% and 2%, respectively. These sectors benefited from the hopeful economic outlook promoted by the rate-cut expectations.
In contrast, energy stocks experienced a slight downturn, decreasing by 0.4%. This dip was primarily attributed to the ongoing drop in oil prices, marking the second consecutive day of decline.
Eurozone: STOXX Markets Eye New Peaks
On Thursday, European equity markets displayed a steady stance. The STOXX 50 is on the cusp of reaching an unprecedented 23-year high, while the STOXX 600 is inching towards a remarkable 23-month peak. This stability reflects a growing sense of optimism. The expected rate cuts by key central banks in the US and Europe for the coming year drive this positive outlook.
Furthermore, European shipping firms are grabbing attention. There’s a noticeable revival in global shipping, especially along key routes like the Suez Canal and the Red Sea. This comeback has a significant influence on market trends.
Adding to this upbeat sentiment, MRI Software’s latest research presents an encouraging picture. They report a notable 4% increase in footfall across UK retail destinations on December 26th. This spike suggests a strong post-holiday shopping trend, reinforcing the floating market atmosphere.
For the year, the performance of the STOXX indices is noteworthy. The STOXX 50 is poised for an impressive near 19% gain, and the STOXX 600 targets a close to 13% rise. Particularly, sectors like technology and retail are leading these advances.

J.J Edwards is a finance expert with 15+ years in forex, hedge funds, trading systems, and market analysis.


