...

GBPUSD Technical Analysis: EMA 50 in Focus

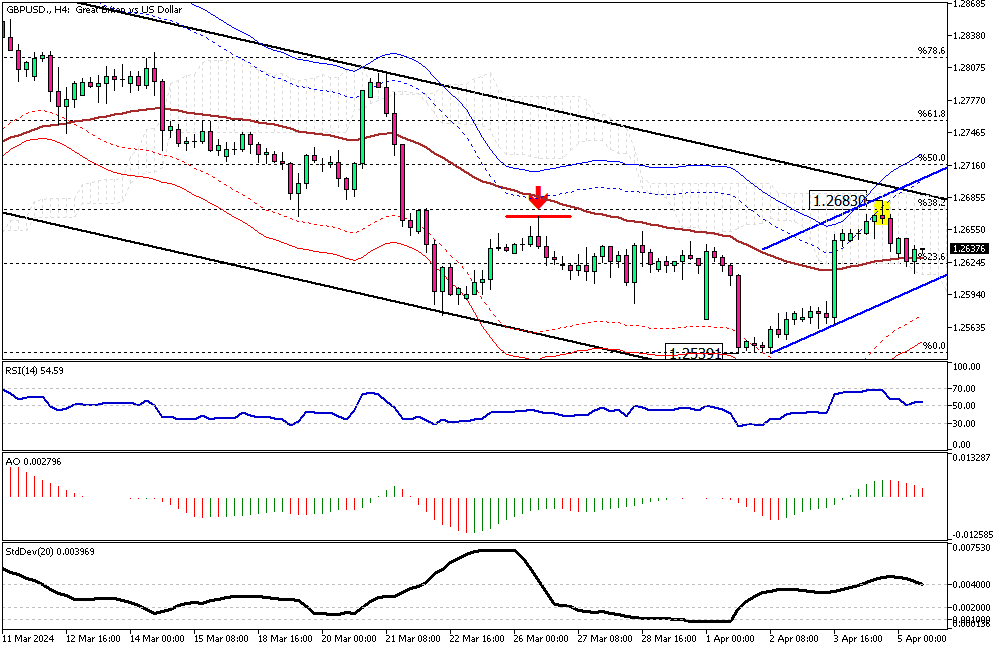
GBPUSD Technical Analysis – The pound sterling rose to 1.268 against the U.S. Dollar in yesterday’s trading session, marking the highest point in April. Examining the GBPUSD 4-hour chart, we notice a long wick candlestick has formed, reaching its highest price at 1.268. This price point is close to the upper band of the downward flag and is also supported by the Ichimoku cloud and the 38.2% Fibonacci level.

This vital resistance area paused the uptick momentum, and as a result, the U.S. Dollar made a comeback. As of writing, the GBPUSD trades near the EMA 50, at about 1.263.
GBPUSD Technical Analysis

GBPUSD Technical Analysis: The Scenario Bullish

From a technical standpoint, the pair is trending in a bear market, and if the price can stabilize itself below the EMA 50, the downtrend is likely to continue. The next bearish target in this scenario could be to test April’s lowest point, the 1.2539 mark.

GBPUSD Bearish Scenario

Conversely, the bear market should be canceled if the GBPUSD price breaks above the 38.2% Fibonacci resistance level or the 1.268 mark. However, this scenario appears weaker because the technical indicators support continuing the bear market.

Analysts at Fxnews suggest carefully monitoring the EMA 50 and the 38.2% Fibonacci level to plan your trading strategies accordingly.

Latest Posts

Gold Exceeded $2665: Now Overbought!

Gold exceeded $2665 resistance. However, robust buying pressure made...

USDMXN Breaks Above 20.53: Key Levels and Analysis

USDMXN breaks above 20.53 resistance in continuation of its...

EURJPY Bounced From 162.4: A Bullish Signal

EURJPY bounced from 162.4 support, resuming its bullish trajectory....

Bullish Symmetrical Triangle Signals NATGAS Breakout

NATGAS trades sideways in a low-momentum market inside the...

Crude Oil Holds at $72.8 After Initial Price Dip

Crude Oil price dipped from $75.24, testing the %50.0...

Gold Exceeded $2665: Now Overbought!

Gold exceeded $2665 resistance. However, robust buying pressure made...

Bullish Symmetrical Triangle Signals NATGAS Breakout

NATGAS trades sideways in a low-momentum market inside the...

Crude Oil Holds at $72.8 After Initial Price Dip

Crude Oil price dipped from $75.24, testing the %50.0...

Gold Stays Below $2665 Ahead of US Economic Data

On Monday, the price of gold remained below $2,665...

US Gasoline Futures Hit $2.07 Amid Oil Surge Amid Oil Surge

Gasoline futures in the US have climbed past $2.03...

NATGAS Dips 14% Amid Low Storage Draws

Natural gas prices in the U.S. fell sharply by...

WTI Crude Slips From $74 as Dollar Strengthens

Crude oil prices for West Texas Intermediate (WTI) dipped...

NATGAS is Hit $4 As the Year Ends

NATGAS hit $4.0, trading in a robust uptrend. The...