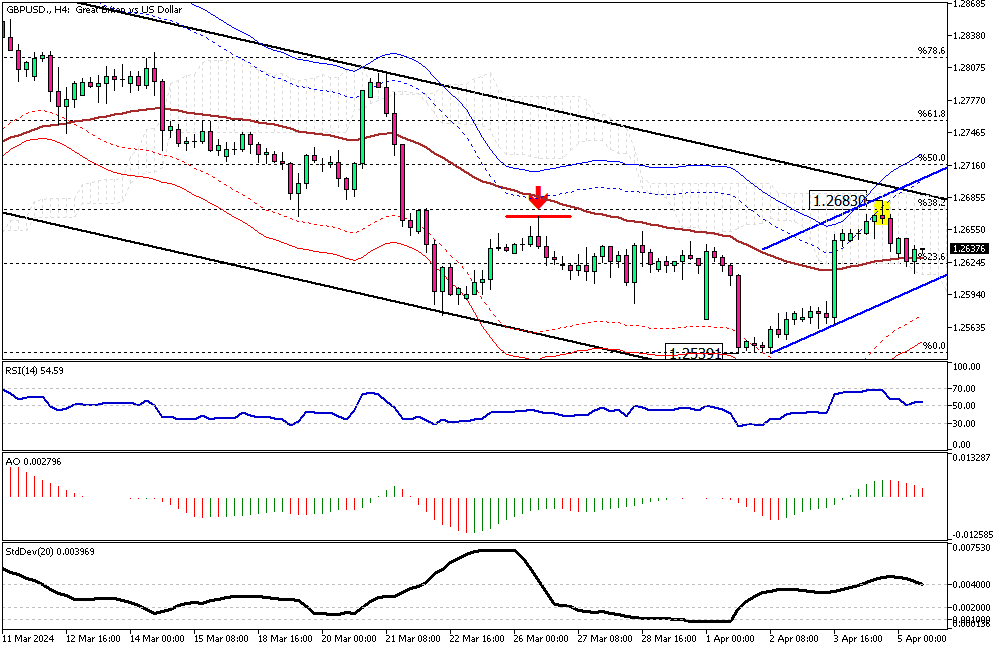
GBPUSD Technical Analysis – The pound sterling rose to 1.268 against the U.S. Dollar in yesterday’s trading session, marking the highest point in April. Examining the GBPUSD 4-hour chart, we notice a long wick candlestick has formed, reaching its highest price at 1.268. This price point is close to the upper band of the downward flag and is also supported by the Ichimoku cloud and the 38.2% Fibonacci level.
This vital resistance area paused the uptick momentum, and as a result, the U.S. Dollar made a comeback. As of writing, the GBPUSD trades near the EMA 50, at about 1.263.

GBPUSD Technical Analysis: The Scenario Bullish
From a technical standpoint, the pair is trending in a bear market, and if the price can stabilize itself below the EMA 50, the downtrend is likely to continue. The next bearish target in this scenario could be to test April’s lowest point, the 1.2539 mark.
GBPUSD Bearish Scenario
Conversely, the bear market should be canceled if the GBPUSD price breaks above the 38.2% Fibonacci resistance level or the 1.268 mark. However, this scenario appears weaker because the technical indicators support continuing the bear market.
Analysts at Fxnews suggest carefully monitoring the EMA 50 and the 38.2% Fibonacci level to plan your trading strategies accordingly.