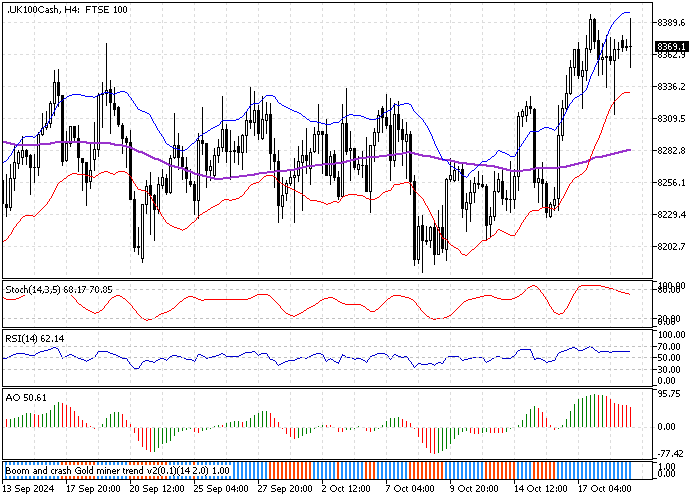
FxNews—The FTSE 100 index saw a modest increase, reaching 8,380 on Monday, maintaining its upward trend from the previous week. This was largely due to the strong performance of major commodity producers, as investors evaluated the economic environment to understand its impact on borrowing terms.

Mining Stocks Rise After China’s Loan Rate Cut

Fresnillo was at the forefront of the market upturn, with its shares climbing 4.4%. This surge was in sync with the rising prices of precious metals. Since the market closed on Friday, gold hit a new all-time high, and silver reached its highest price in 12 years.
Companies mining base metals experienced gains following a significant reduction in the People’s Bank of China’s loan prime rates. Notably, Antofagasta, Glencore, and Endeavour saw their stock prices increase by nearly 2%. Rio Tinto and Anglo-Americans also enjoyed growth, with almost a 1% rise.
Shell and BP Stocks Rise Amid Oil Price Hike

Energy giants Shell and BP saw their stock values increase by about 1%, buoyed by the rising crude oil prices. This increase reflects ongoing adjustments by traders who are factoring in the geopolitical uncertainties in the Middle East.
Contrary to other sectors, banks didn’t perform as well. Barclays and Lloyds barely moved, showing no significant change, while HSBC experienced a slight decline.
GBPUSD Technical Analysis – 21-October-2024

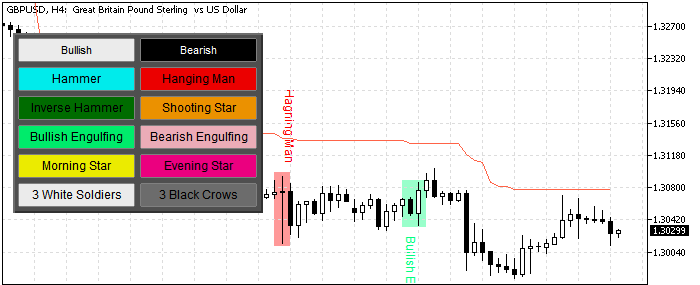
The British pound trades bearish against the U.S. dollar because its price is below the 100-period simple moving average and the Ichimoku Cloud indicator. As of this writing, the GBP/USD currency pair trades at approximately $1.302, pulling back from the upper line of the bearish flag, which is neighboring the upper band of the Envelopes indicator.
The Awesome Oscillator has been signaling divergence. Besides, with its blue histogram, the Boom and Crash Gold Miner Trend indicator signals to buy. On the other hand, the Relative Strength Index indicator floats below the median line, meaning the bear market gains momentum.

Additionally, the price is below the Supertrend line, adding credit to the bear market. Overall, the technical indicators suggest the primary trend is bearish, while GBP/USD can potentially consolidate near the upper resistance levels.
GBPUSD Forecast – 21-October-2024

The immediate resistance is at $1.311, the October 8 high. From a technical perspective, the downtrend will likely resume if GBP/USD remains below this resistance. However, bears should close below the immediate support at $1.30 for the downtrend to resume.

Notably, the $1.30 coincides with the median line of the Bollinger Bands, making the $1.30 support a vital point for resuming the bear market.
If this scenario unfolds, the GBP/USD price could initially fill the ‘Fair Value Gap’ at $1.299. Furthermore, if the selling pressure exceeds $1.$1.29, the downtrend will likely extend to the next supply zone at $1.295, the daily 100-period SMA.

Please note that the bearish outlook should be invalidated if the GBP/USD price exceeds the 1.311 resistance.
GBPUSD Bullish Scenario

The immediate resistance is $1.311, a barrier backed by the 100-SMA of the 4-hour chart. If bulls pull the price above this resistance, the uptick momentum from $1.295 could spread to the September 17 low at $1.315, followed by the August 27 high at $1.326.
GBPUSD Support and Resistance Levels – 21-October-2024
Traders and investors should closely monitor the key levels below to make informed decisions and adjust their strategies accordingly as market conditions shift.
- Support: $1.3 / $1.295 / $1.286
- Resistance: $1.311 / $1.315 / $1.326

J.J Edwards is a finance expert with 15+ years in forex, hedge funds, trading systems, and market analysis.
