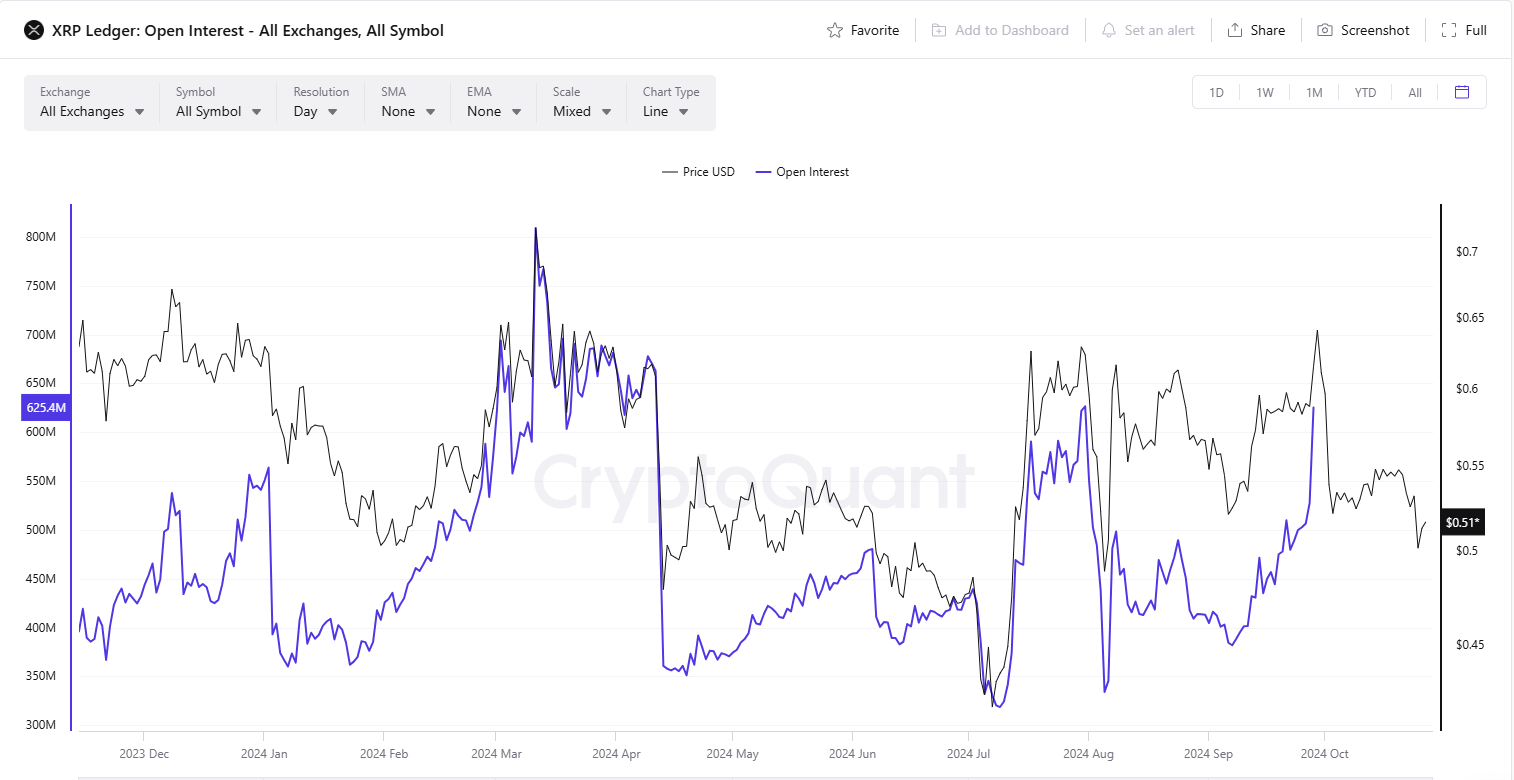
FxNews—Ripple‘s open interest (OI) across various trading platforms has increased. This gradual uptick indicates that more participants, including buyers and sellers, are getting involved.

Open Interest Hits 510.7 Million, Signaling Big Moves Ahead
Recent figures put the OI at about 510.7 million. At this level, significant price movements have often occurred in the past. A rise in OI usually means more money is entering the market, with traders opening new positions in anticipation of a big price change.
In Ripple’s trading history, large increases in OI typically lead to more price fluctuations. Such conditions suggest that a significant price change, either upward or downward, might soon happen.
Ripple Nears Resistance Level at $0.519

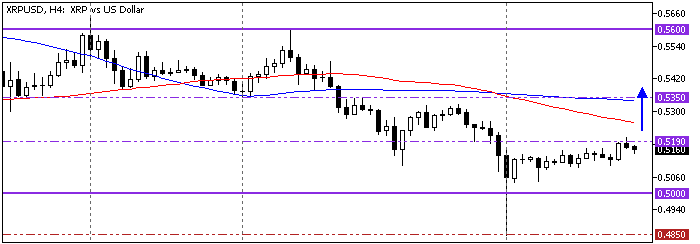
Ripple (XRP) traded at approximately $0.515 and tested the October 8 low at $0.519 as resistance. The Stochastic Oscillator is on the rise and about to flip into overbought territory, meaning that despite the lack of momentum in the chart, Ripple could become overpriced.

On the other hand, the Awesome Oscillator histogram is green and approaching the signal line, and the 4-hour chart formed a bullish hammer candlestick pattern. Meanwhile, XRP/USD is below the 50- and 100-period simple moving averages, meaning the primary trend is bearish.
Overall, the technical indicators suggest that while the primary trend is bearish, the XRP/USD price could rise toward upper resistance levels.
Can Ripple Break $0.519 Resistance Soon?

Immediate resistance to the bullish momentum from $0.485 lies at $0.519. If bulls pull the price above this resistance, Ripple’s price could rise to the $0.535 resistance, backed by a 100-period SMA.
Furthermore, if the buying pressure exceeds $0.535, the next bullish target could be the October 17 high at $0.560.
Ripple Bearish Scenario
Conversely, the bullish outlook should be invalidated if XRP/USD falls below the $0.5 immediate support. If this scenario unfolds, the next bearish target could be $0.485, followed by the $0.45 mark.